TegaIndustries TEGA full analysis,charts,indicators,moving averages,SMA,DMA,EMA,ADX,MACD,RSITega Industries TEGA WideScreen charts, DMA,SMA,EMA technical analysis, forecast prediction, by indicators ADX,MACD,RSI,CCI NSE stock exchange
Daily price and charts and targets TegaIndustries Strong Daily Stock price targets for TegaIndustries TEGA are 1905.1 and 1932.1 | Daily Target 1 | 1883.73 | | Daily Target 2 | 1899.47 | | Daily Target 3 | 1910.7333333333 | | Daily Target 4 | 1926.47 | | Daily Target 5 | 1937.73 |
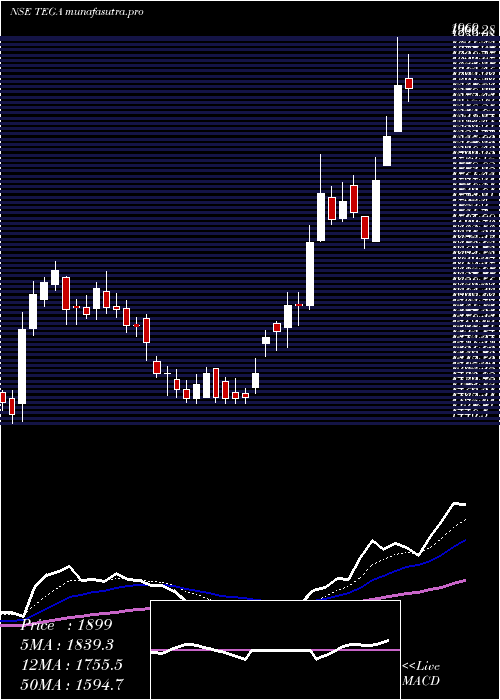
Daily price and volume Tega Industries
| Date |
Closing |
Open |
Range |
Volume |
Tue 28 October 2025 |
1915.20 (1.04%) |
1905.00 |
1895.00 - 1922.00 |
0.4745 times |
Mon 27 October 2025 |
1895.50 (0.55%) |
1881.00 |
1880.00 - 1908.10 |
0.8966 times |
Fri 24 October 2025 |
1885.10 (-2.35%) |
1931.00 |
1861.10 - 1940.10 |
1.3602 times |
Thu 23 October 2025 |
1930.50 (0.15%) |
1934.60 |
1922.00 - 1944.00 |
0.6771 times |
Tue 21 October 2025 |
1927.70 (0.63%) |
1925.00 |
1915.60 - 1945.00 |
0.2313 times |
Mon 20 October 2025 |
1915.60 (1.59%) |
1889.00 |
1885.60 - 1928.50 |
1.599 times |
Fri 17 October 2025 |
1885.60 (-0.62%) |
1900.00 |
1842.30 - 1910.00 |
1.2815 times |
Thu 16 October 2025 |
1897.30 (-1.32%) |
1928.00 |
1882.30 - 1938.90 |
1.9538 times |
Wed 15 October 2025 |
1922.60 (-0.64%) |
1943.70 |
1910.20 - 1947.00 |
0.7843 times |
Tue 14 October 2025 |
1934.90 (0.25%) |
1920.00 |
1909.10 - 1940.30 |
0.7415 times |
Mon 13 October 2025 |
1930.00 (-0.76%) |
1944.00 |
1920.00 - 1953.50 |
0.7904 times |
Weekly price and charts TegaIndustries Strong weekly Stock price targets for TegaIndustries TEGA are 1897.6 and 1939.6 | Weekly Target 1 | 1863.73 | | Weekly Target 2 | 1889.47 | | Weekly Target 3 | 1905.7333333333 | | Weekly Target 4 | 1931.47 | | Weekly Target 5 | 1947.73 |
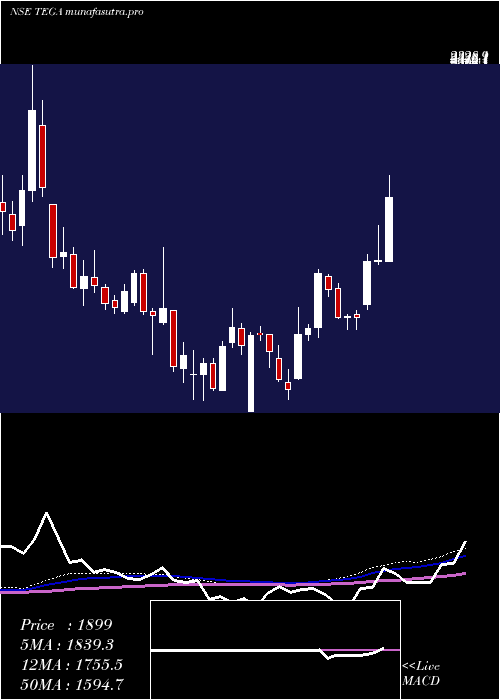
Weekly price and volumes for Tega Industries
| Date |
Closing |
Open |
Range |
Volume |
Tue 28 October 2025 |
1915.20 (1.6%) |
1881.00 |
1880.00 - 1922.00 |
0.0942 times |
Fri 24 October 2025 |
1885.10 (-0.03%) |
1889.00 |
1861.10 - 1945.00 |
0.2656 times |
Fri 17 October 2025 |
1885.60 (-3.04%) |
1944.00 |
1842.30 - 1953.50 |
0.3812 times |
Fri 10 October 2025 |
1944.80 (-1.48%) |
1964.40 |
1930.00 - 1975.00 |
0.3041 times |
Fri 03 October 2025 |
1974.00 (1.64%) |
1944.80 |
1868.40 - 2000.00 |
0.6666 times |
Fri 26 September 2025 |
1942.10 (-3.62%) |
2030.00 |
1900.00 - 2031.00 |
0.8517 times |
Fri 19 September 2025 |
2015.10 (-0.05%) |
2040.00 |
2005.10 - 2125.00 |
2.6232 times |
Fri 12 September 2025 |
2016.10 (-2.33%) |
2090.00 |
1917.70 - 2112.90 |
3.0348 times |
Fri 05 September 2025 |
2064.20 (11.77%) |
1874.60 |
1851.00 - 2080.00 |
1.4786 times |
Fri 29 August 2025 |
1846.90 (-1.47%) |
1879.30 |
1785.00 - 1914.00 |
0.3 times |
Fri 22 August 2025 |
1874.50 (1.26%) |
1866.00 |
1776.70 - 1901.00 |
0.3874 times |
Monthly price and charts TegaIndustries Strong monthly Stock price targets for TegaIndustries TEGA are 1878.75 and 2036.45 | Monthly Target 1 | 1761.47 | | Monthly Target 2 | 1838.33 | | Monthly Target 3 | 1919.1666666667 | | Monthly Target 4 | 1996.03 | | Monthly Target 5 | 2076.87 |
Monthly price and volumes Tega Industries
| Date |
Closing |
Open |
Range |
Volume |
Tue 28 October 2025 |
1915.20 (1.27%) |
1904.00 |
1842.30 - 2000.00 |
0.7024 times |
Tue 30 September 2025 |
1891.10 (2.39%) |
1874.60 |
1851.00 - 2125.00 |
4.5126 times |
Fri 29 August 2025 |
1846.90 (-3.1%) |
1898.00 |
1776.70 - 1929.60 |
0.8149 times |
Thu 31 July 2025 |
1906.00 (22.36%) |
1576.90 |
1540.00 - 2010.10 |
2.2193 times |
Mon 30 June 2025 |
1557.70 (-5.59%) |
1640.10 |
1467.00 - 1648.00 |
0.2046 times |
Fri 30 May 2025 |
1650.00 (22.08%) |
1351.60 |
1240.00 - 1662.00 |
0.4051 times |
Wed 30 April 2025 |
1351.60 (-8.41%) |
1470.00 |
1200.05 - 1488.70 |
0.147 times |
Fri 28 March 2025 |
1475.70 (11.55%) |
1322.85 |
1237.60 - 1535.85 |
0.1877 times |
Fri 28 February 2025 |
1322.85 (-12.58%) |
1492.05 |
1240.85 - 1736.50 |
0.5955 times |
Fri 31 January 2025 |
1513.20 (-3.39%) |
1566.35 |
1386.05 - 1663.00 |
0.211 times |
Tue 31 December 2024 |
1566.35 (-8.93%) |
1711.00 |
1520.00 - 1734.95 |
0.6367 times |

DMA SMA EMA moving averages of Tega Industries TEGA
DMA (daily moving average) of Tega Industries TEGA
| DMA period | DMA value | | 5 day DMA | 1910.8 | | 12 day DMA | 1915.4 | | 20 day DMA | 1921.59 | | 35 day DMA | 1962.37 | | 50 day DMA | 1941.41 | | 100 day DMA | 1829.21 | | 150 day DMA | 1699.51 | | 200 day DMA | 1639.09 | EMA (exponential moving average) of Tega Industries TEGA
| EMA period | EMA current | EMA prev | EMA prev2 | | 5 day EMA | 1908.18 | 1904.67 | 1909.25 | | 12 day EMA | 1915.73 | 1915.83 | 1919.52 | | 20 day EMA | 1923.67 | 1924.56 | 1927.62 | | 35 day EMA | 1924.66 | 1925.22 | 1926.97 | | 50 day EMA | 1929.27 | 1929.84 | 1931.24 |
SMA (simple moving average) of Tega Industries TEGA
| SMA period | SMA current | SMA prev | SMA prev2 | | 5 day SMA | 1910.8 | 1910.88 | 1908.9 | | 12 day SMA | 1915.4 | 1918.01 | 1921.77 | | 20 day SMA | 1921.59 | 1922.93 | 1925.7 | | 35 day SMA | 1962.37 | 1966.62 | 1968.8 | | 50 day SMA | 1941.41 | 1939.89 | 1938.19 | | 100 day SMA | 1829.21 | 1825.95 | 1822.99 | | 150 day SMA | 1699.51 | 1695.82 | 1692.18 | | 200 day SMA | 1639.09 | 1637.3 | 1635.51 |
|
|
