TridentTechlabs TECHLABS_SM full analysis,charts,indicators,moving averages,SMA,DMA,EMA,ADX,MACD,RSITrident Techlabs TECHLABS_SM WideScreen charts, DMA,SMA,EMA technical analysis, forecast prediction, by indicators ADX,MACD,RSI,CCI NSE stock exchange
Daily price and charts and targets TridentTechlabs Strong Daily Stock price targets for TridentTechlabs TECHLABS_SM are 434.23 and 453.23 | Daily Target 1 | 430.15 | | Daily Target 2 | 438.3 | | Daily Target 3 | 449.15 | | Daily Target 4 | 457.3 | | Daily Target 5 | 468.15 |
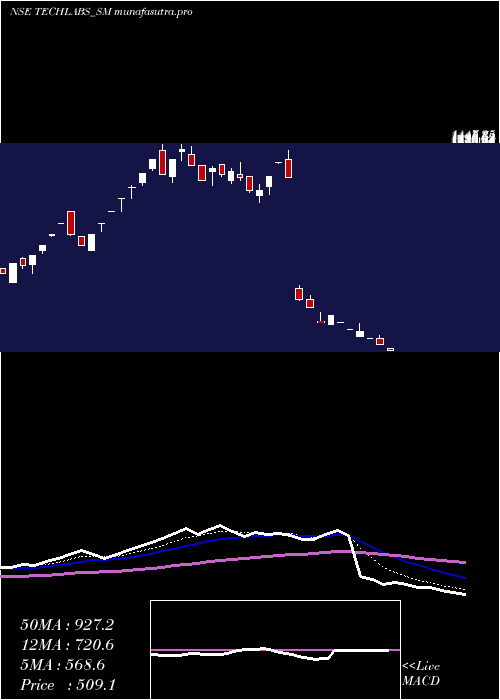
Daily price and volume Trident Techlabs
| Date |
Closing |
Open |
Range |
Volume |
Wed 29 October 2025 |
446.45 (-1.73%) |
454.00 |
441.00 - 460.00 |
0.5472 times |
Tue 28 October 2025 |
454.30 (-1.14%) |
453.00 |
449.95 - 457.40 |
0.5975 times |
Mon 27 October 2025 |
459.55 (-1.36%) |
464.95 |
450.00 - 466.00 |
1.4843 times |
Fri 24 October 2025 |
465.90 (2.32%) |
462.95 |
435.00 - 475.00 |
2.1384 times |
Thu 23 October 2025 |
455.35 (-1.92%) |
460.00 |
452.30 - 467.00 |
0.5157 times |
Tue 21 October 2025 |
464.25 (2.68%) |
455.00 |
450.00 - 470.00 |
0.7862 times |
Mon 20 October 2025 |
452.15 (-2.39%) |
463.20 |
448.60 - 475.00 |
0.9119 times |
Fri 17 October 2025 |
463.20 (0.15%) |
462.95 |
454.85 - 468.00 |
1.4654 times |
Thu 16 October 2025 |
462.50 (-0.83%) |
466.35 |
455.05 - 470.00 |
0.4717 times |
Wed 15 October 2025 |
466.35 (4.26%) |
447.30 |
445.00 - 469.65 |
1.0818 times |
Tue 14 October 2025 |
447.30 (-4.99%) |
476.00 |
447.30 - 478.00 |
0.9874 times |
Weekly price and charts TridentTechlabs Strong weekly Stock price targets for TridentTechlabs TECHLABS_SM are 431.23 and 456.23 | Weekly Target 1 | 426.15 | | Weekly Target 2 | 436.3 | | Weekly Target 3 | 451.15 | | Weekly Target 4 | 461.3 | | Weekly Target 5 | 476.15 |
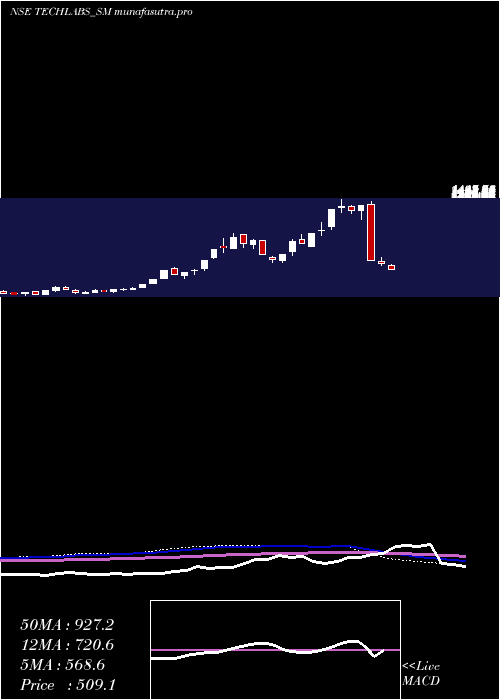
Weekly price and volumes for Trident Techlabs
| Date |
Closing |
Open |
Range |
Volume |
Wed 29 October 2025 |
446.45 (-4.17%) |
464.95 |
441.00 - 466.00 |
0.3622 times |
Fri 24 October 2025 |
465.90 (0.58%) |
463.20 |
435.00 - 475.00 |
0.5997 times |
Fri 17 October 2025 |
463.20 (-4.73%) |
479.00 |
445.00 - 479.00 |
0.5988 times |
Fri 10 October 2025 |
486.20 (-1.1%) |
496.00 |
453.25 - 497.00 |
0.9446 times |
Fri 03 October 2025 |
491.60 (-2.1%) |
505.00 |
477.05 - 510.00 |
0.3389 times |
Fri 26 September 2025 |
502.15 (-8.3%) |
547.60 |
495.00 - 548.95 |
1.5443 times |
Fri 19 September 2025 |
547.60 (0.19%) |
558.00 |
530.00 - 576.00 |
0.7193 times |
Fri 12 September 2025 |
546.55 (-10.17%) |
612.00 |
544.75 - 649.90 |
1.4325 times |
Fri 05 September 2025 |
608.40 (9.25%) |
558.00 |
546.10 - 660.00 |
1.696 times |
Fri 29 August 2025 |
556.90 (-1.99%) |
596.60 |
510.05 - 596.60 |
1.7636 times |
Fri 22 August 2025 |
568.20 (11.62%) |
490.00 |
475.25 - 568.20 |
1.2367 times |
Monthly price and charts TridentTechlabs Strong monthly Stock price targets for TridentTechlabs TECHLABS_SM are 404.23 and 477.23 | Monthly Target 1 | 390.15 | | Monthly Target 2 | 418.3 | | Monthly Target 3 | 463.15 | | Monthly Target 4 | 491.3 | | Monthly Target 5 | 536.15 |
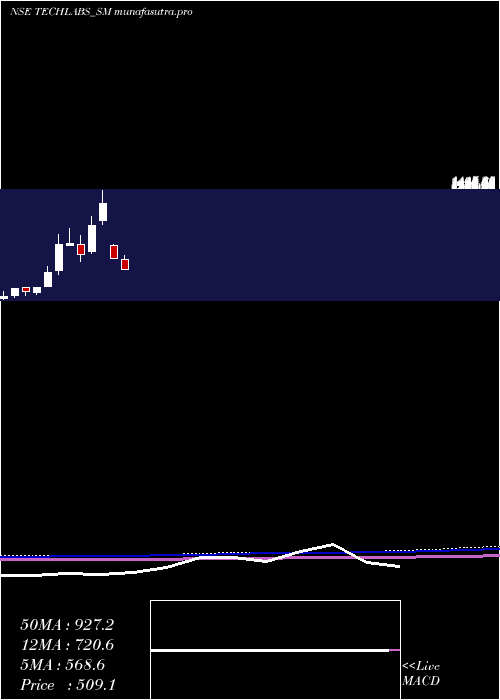
Monthly price and volumes Trident Techlabs
| Date |
Closing |
Open |
Range |
Volume |
Wed 29 October 2025 |
446.45 (-10.53%) |
494.05 |
435.00 - 508.00 |
0.4797 times |
Tue 30 September 2025 |
499.00 (-10.4%) |
558.00 |
477.05 - 660.00 |
0.993 times |
Fri 29 August 2025 |
556.90 (9.4%) |
490.00 |
475.25 - 596.60 |
0.5365 times |
Wed 09 April 2025 |
509.05 (-19.94%) |
624.00 |
509.05 - 667.60 |
0.9328 times |
Fri 28 March 2025 |
635.85 (-50.98%) |
789.00 |
635.85 - 803.15 |
0.5197 times |
Mon 30 December 2024 |
1297.20 (25.16%) |
1088.20 |
1050.00 - 1447.25 |
1.6416 times |
Fri 29 November 2024 |
1036.40 (51.81%) |
716.80 |
701.00 - 1143.25 |
1.4586 times |
Thu 31 October 2024 |
682.70 (-16.43%) |
801.50 |
606.70 - 914.50 |
1.1881 times |
Mon 15 July 2024 |
816.95 (0.75%) |
790.20 |
790.20 - 998.00 |
0.7655 times |
Fri 28 June 2024 |
810.85 (71.34%) |
496.90 |
448.45 - 920.00 |
1.4845 times |
Fri 31 May 2024 |
473.25 (63.78%) |
303.35 |
299.00 - 547.00 |
3.0136 times |
DMA SMA EMA moving averages of Trident Techlabs TECHLABS_SM
DMA (daily moving average) of Trident Techlabs TECHLABS_SM
| DMA period | DMA value | | 5 day DMA | 456.31 | | 12 day DMA | 459.01 | | 20 day DMA | 469.19 | | 35 day DMA | 500.83 | | 50 day DMA | 519.73 | | 100 day DMA | 761.11 | | 150 day DMA | 747.74 | | 200 day DMA | 636.66 | EMA (exponential moving average) of Trident Techlabs TECHLABS_SM
| EMA period | EMA current | EMA prev | EMA prev2 | | 5 day EMA | 454.66 | 458.77 | 461.01 | | 12 day EMA | 462.12 | 464.97 | 466.91 | | 20 day EMA | 472.84 | 475.62 | 477.86 | | 35 day EMA | 493.64 | 496.42 | 498.9 | | 50 day EMA | 516.76 | 519.63 | 522.3 |
SMA (simple moving average) of Trident Techlabs TECHLABS_SM
| SMA period | SMA current | SMA prev | SMA prev2 | | 5 day SMA | 456.31 | 459.87 | 459.44 | | 12 day SMA | 459.01 | 462.32 | 464.33 | | 20 day SMA | 469.19 | 471.79 | 474.18 | | 35 day SMA | 500.83 | 506.23 | 510.63 | | 50 day SMA | 519.73 | 520.98 | 522.61 | | 100 day SMA | 761.11 | 763.14 | 764.79 | | 150 day SMA | 747.74 | 747.49 | 747.33 | | 200 day SMA | 636.66 | 635.59 | 634.54 |
|
|
