TecheraEngineer TECHERA_SM full analysis,charts,indicators,moving averages,SMA,DMA,EMA,ADX,MACD,RSITechera Engineer TECHERA_SM WideScreen charts, DMA,SMA,EMA technical analysis, forecast prediction, by indicators ADX,MACD,RSI,CCI NSE stock exchange
Daily price and charts and targets TecheraEngineer Strong Daily Stock price targets for TecheraEngineer TECHERA_SM are 119.5 and 125 | Daily Target 1 | 115 | | Daily Target 2 | 118.5 | | Daily Target 3 | 120.5 | | Daily Target 4 | 124 | | Daily Target 5 | 126 |
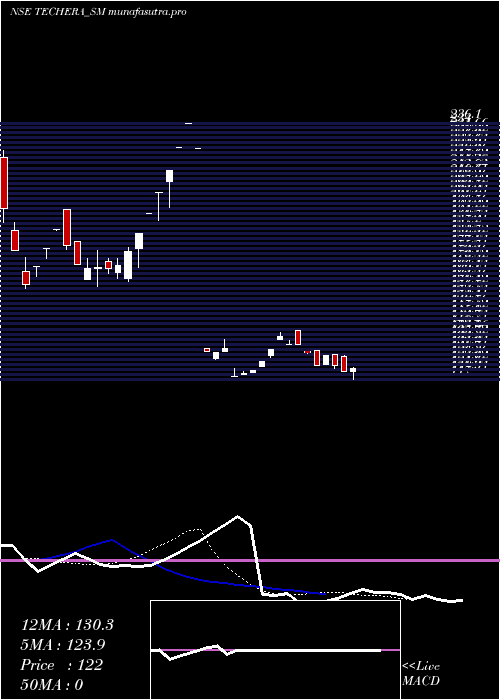
Daily price and volume Techera Engineer
| Date |
Closing |
Open |
Range |
Volume |
| Fri 02 May 2025 |
122.00 (1.16%) |
120.60 |
117.00 - 122.50 |
0.2825 times |
| Wed 30 April 2025 |
120.60 (-2.15%) |
127.65 |
120.60 - 128.30 |
1.1299 times |
| Tue 29 April 2025 |
123.25 (-3.94%) |
128.50 |
122.10 - 128.50 |
0.565 times |
| Mon 28 April 2025 |
128.30 (3.89%) |
124.10 |
124.10 - 128.30 |
0.452 times |
| Fri 25 April 2025 |
123.50 (-4.74%) |
130.25 |
123.50 - 130.25 |
1.3559 times |
| Thu 24 April 2025 |
129.65 (-2.67%) |
130.10 |
129.00 - 130.10 |
1.9209 times |
| Tue 22 April 2025 |
133.20 (0.15%) |
139.50 |
133.00 - 139.50 |
0.904 times |
| Mon 21 April 2025 |
133.00 (-2.74%) |
133.00 |
133.00 - 135.00 |
1.5819 times |
| Thu 17 April 2025 |
136.75 (4.39%) |
135.75 |
135.75 - 139.00 |
0.452 times |
| Wed 16 April 2025 |
131.00 (4.38%) |
128.00 |
127.00 - 131.00 |
1.3559 times |
| Tue 15 April 2025 |
125.50 (3.59%) |
123.00 |
123.00 - 125.50 |
0.226 times |
Weekly price and charts TecheraEngineer Strong weekly Stock price targets for TecheraEngineer TECHERA_SM are 113.75 and 125.25 | Weekly Target 1 | 111 | | Weekly Target 2 | 116.5 | | Weekly Target 3 | 122.5 | | Weekly Target 4 | 128 | | Weekly Target 5 | 134 |
Weekly price and volumes for Techera Engineer
| Date |
Closing |
Open |
Range |
Volume |
| Fri 02 May 2025 |
122.00 (-1.21%) |
124.10 |
117.00 - 128.50 |
0.1069 times |
| Fri 25 April 2025 |
123.50 (-9.69%) |
133.00 |
123.50 - 139.50 |
0.2535 times |
| Thu 17 April 2025 |
136.75 (12.88%) |
123.00 |
123.00 - 139.00 |
0.0895 times |
| Fri 11 April 2025 |
121.15 (-7.73%) |
118.20 |
118.20 - 122.00 |
0.2287 times |
| Thu 03 April 2025 |
131.30 (-41.46%) |
131.50 |
126.25 - 135.45 |
0.1292 times |
| Wed 13 November 2024 |
224.30 (4.72%) |
224.90 |
224.30 - 236.10 |
0.3778 times |
| Fri 08 November 2024 |
214.20 (26.07%) |
164.00 |
162.50 - 214.20 |
2.3612 times |
| Fri 01 November 2024 |
169.90 (-5.32%) |
181.00 |
160.15 - 181.00 |
2.1077 times |
| Fri 25 October 2024 |
179.45 (0%) |
167.10 |
159.25 - 195.90 |
3.3455 times |
| Mon 05 May 2025 |
(0%) |
|
- |
0 times |

Monthly price and charts TecheraEngineer Strong monthly Stock price targets for TecheraEngineer TECHERA_SM are 119.5 and 125 | Monthly Target 1 | 115 | | Monthly Target 2 | 118.5 | | Monthly Target 3 | 120.5 | | Monthly Target 4 | 124 | | Monthly Target 5 | 126 |
Monthly price and volumes Techera Engineer
| Date |
Closing |
Open |
Range |
Volume |
| Fri 02 May 2025 |
122.00 (1.16%) |
120.60 |
117.00 - 122.50 |
0.0037 times |
| Wed 30 April 2025 |
120.60 (-46.23%) |
131.50 |
118.20 - 139.50 |
0.2348 times |
| Wed 13 November 2024 |
224.30 (33.12%) |
166.55 |
162.50 - 236.10 |
0.8791 times |
| Thu 31 October 2024 |
168.50 (0%) |
219.95 |
159.25 - 223.60 |
2.8824 times |
| Mon 05 May 2025 |
(0%) |
|
- |
0 times |

DMA SMA EMA moving averages of Techera Engineer TECHERA_SM
DMA (daily moving average) of Techera Engineer TECHERA_SM
| DMA period | DMA value | | 5 day DMA | 123.53 | | 12 day DMA | 127.33 | | 20 day DMA | 142.09 | | 35 day DMA | 158.19 | | 50 day DMA | | | 100 day DMA | | | 150 day DMA | | | 200 day DMA | | EMA (exponential moving average) of Techera Engineer TECHERA_SM
| EMA period | EMA current | EMA prev | EMA prev2 | | 5 day EMA | 123.87 | 124.8 | 126.9 | | 12 day EMA | 130.29 | 131.8 | 133.84 | | 20 day EMA | 137.49 | 139.12 | 141.07 | | 35 day EMA | 157.53 | 159.62 | 161.92 | | 50 day EMA | 0 | 0 | 0 |
SMA (simple moving average) of Techera Engineer TECHERA_SM
| SMA period | SMA current | SMA prev | SMA prev2 | | 5 day SMA | 123.53 | 125.06 | 127.58 | | 12 day SMA | 127.33 | 127.13 | 126.93 | | 20 day SMA | 142.09 | 146.7 | 150.87 | | 35 day SMA | 158.19 | | 50 day SMA | | 100 day SMA | | 150 day SMA | | 200 day SMA |
|
|
