TciFinance TCIFINANCE full analysis,charts,indicators,moving averages,SMA,DMA,EMA,ADX,MACD,RSITci Finance TCIFINANCE WideScreen charts, DMA,SMA,EMA technical analysis, forecast prediction, by indicators ADX,MACD,RSI,CCI NSE stock exchange
operates under Finance (including NBFCs) sector
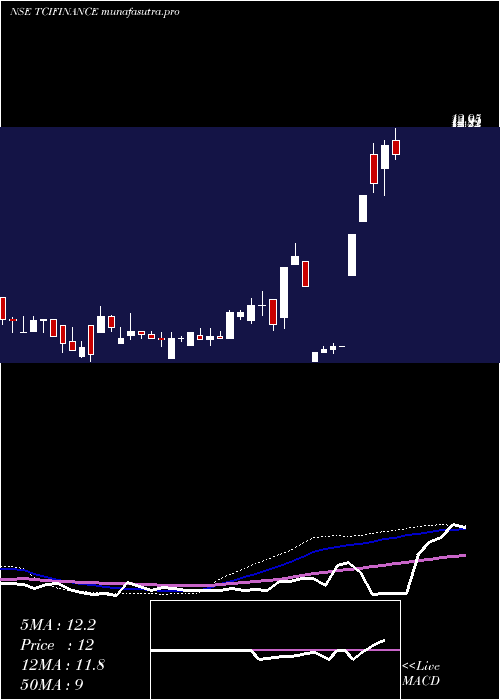
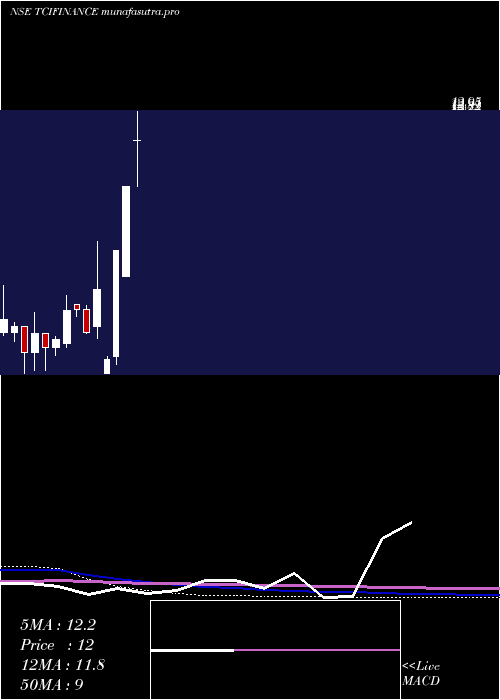
Daily price and charts and targets TciFinance Strong Daily Stock price targets for TciFinance TCIFINANCE are 11.76 and 13.21 | Daily Target 1 | 10.6 | | Daily Target 2 | 11.46 | | Daily Target 3 | 12.053333333333 | | Daily Target 4 | 12.91 | | Daily Target 5 | 13.5 |
Daily price and volume Tci Finance
| Date |
Closing |
Open |
Range |
Volume |
Tue 28 October 2025 |
12.31 (3.79%) |
11.62 |
11.20 - 12.65 |
1.1858 times |
Mon 27 October 2025 |
11.86 (-0.25%) |
11.89 |
11.85 - 12.40 |
0.7671 times |
Fri 24 October 2025 |
11.89 (-4.57%) |
12.60 |
11.31 - 12.89 |
1.7029 times |
Thu 23 October 2025 |
12.46 (6.22%) |
11.49 |
11.49 - 12.90 |
1.7403 times |
Tue 21 October 2025 |
11.73 (0%) |
11.42 |
11.42 - 11.95 |
0.5185 times |
Mon 20 October 2025 |
11.73 (-0.17%) |
11.75 |
11.01 - 11.90 |
0.4165 times |
Fri 17 October 2025 |
11.75 (-1.34%) |
12.65 |
11.50 - 12.65 |
1.0054 times |
Thu 16 October 2025 |
11.91 (-0.67%) |
12.87 |
11.85 - 12.87 |
1.0106 times |
Wed 15 October 2025 |
11.99 (2.3%) |
11.72 |
11.72 - 12.34 |
0.9307 times |
Tue 14 October 2025 |
11.72 (-2.98%) |
12.32 |
11.70 - 12.32 |
0.7221 times |
Mon 13 October 2025 |
12.08 (0%) |
12.08 |
11.80 - 12.33 |
1.2586 times |

Weekly price and charts TciFinance Strong weekly Stock price targets for TciFinance TCIFINANCE are 11.76 and 13.21 | Weekly Target 1 | 10.6 | | Weekly Target 2 | 11.46 | | Weekly Target 3 | 12.053333333333 | | Weekly Target 4 | 12.91 | | Weekly Target 5 | 13.5 |
Weekly price and volumes for Tci Finance
| Date |
Closing |
Open |
Range |
Volume |
Tue 28 October 2025 |
12.31 (3.53%) |
11.89 |
11.20 - 12.65 |
0.181 times |
Fri 24 October 2025 |
11.89 (1.19%) |
11.75 |
11.01 - 12.90 |
0.4057 times |
Fri 17 October 2025 |
11.75 (-2.73%) |
12.08 |
11.50 - 12.87 |
0.4566 times |
Fri 10 October 2025 |
12.08 (6.9%) |
11.30 |
11.30 - 15.00 |
1.4731 times |
Fri 03 October 2025 |
11.30 (-8.58%) |
12.61 |
11.06 - 12.61 |
0.6966 times |
Fri 26 September 2025 |
12.36 (-27.21%) |
13.70 |
12.30 - 13.70 |
0.5501 times |
Fri 20 June 2025 |
16.98 (4.3%) |
16.87 |
16.81 - 18.83 |
1.8849 times |
Fri 13 June 2025 |
16.28 (32.68%) |
12.79 |
12.10 - 16.28 |
3.2949 times |
Fri 06 June 2025 |
12.27 (-3.16%) |
12.92 |
11.90 - 12.92 |
0.5053 times |
Fri 30 May 2025 |
12.67 (5.32%) |
11.78 |
11.77 - 13.10 |
0.5518 times |
Fri 23 May 2025 |
12.03 (-2.59%) |
12.53 |
11.82 - 12.95 |
0.4028 times |
Monthly price and charts TciFinance Strong monthly Stock price targets for TciFinance TCIFINANCE are 11.66 and 15.65 | Monthly Target 1 | 8.78 | | Monthly Target 2 | 10.55 | | Monthly Target 3 | 12.773333333333 | | Monthly Target 4 | 14.54 | | Monthly Target 5 | 16.76 |
Monthly price and volumes Tci Finance
| Date |
Closing |
Open |
Range |
Volume |
Tue 28 October 2025 |
12.31 (7.14%) |
11.90 |
11.01 - 15.00 |
1.8434 times |
Tue 30 September 2025 |
11.49 (-32.33%) |
13.70 |
11.49 - 13.70 |
0.5751 times |
Fri 20 June 2025 |
16.98 (34.02%) |
12.92 |
11.90 - 18.83 |
3.6537 times |
Fri 30 May 2025 |
12.67 (20.44%) |
12.00 |
10.51 - 13.10 |
1.7461 times |
Wed 12 June 2024 |
10.52 (110.4%) |
7.60 |
7.60 - 10.52 |
0.8382 times |
Mon 11 July 2022 |
5.00 (2.04%) |
0.00 |
4.75 - 5.10 |
0.0109 times |
Thu 30 June 2022 |
4.90 (-31.94%) |
4.45 |
4.45 - 5.00 |
0.031 times |
Wed 20 April 2022 |
7.20 (24.14%) |
6.00 |
5.60 - 8.75 |
0.9139 times |
Thu 31 March 2022 |
5.80 (-11.45%) |
6.55 |
5.75 - 6.65 |
0.333 times |
Mon 03 January 2022 |
6.55 (0.77%) |
6.70 |
6.30 - 6.70 |
0.0549 times |
Fri 31 December 2021 |
6.50 (17.12%) |
5.45 |
5.30 - 7.00 |
0.6909 times |
DMA SMA EMA moving averages of Tci Finance TCIFINANCE
DMA (daily moving average) of Tci Finance TCIFINANCE
| DMA period | DMA value | | 5 day DMA | 12.05 | | 12 day DMA | 11.96 | | 20 day DMA | 12.04 | | 35 day DMA | 13.22 | | 50 day DMA | 12.96 | | 100 day DMA | 10.28 | | 150 day DMA | 8.75 | | 200 day DMA | 7.91 | EMA (exponential moving average) of Tci Finance TCIFINANCE
| EMA period | EMA current | EMA prev | EMA prev2 | | 5 day EMA | 12.06 | 11.94 | 11.98 | | 12 day EMA | 12.11 | 12.07 | 12.11 | | 20 day EMA | 12.3 | 12.3 | 12.35 | | 35 day EMA | 12.44 | 12.45 | 12.49 | | 50 day EMA | 12.77 | 12.79 | 12.83 |
SMA (simple moving average) of Tci Finance TCIFINANCE
| SMA period | SMA current | SMA prev | SMA prev2 | | 5 day SMA | 12.05 | 11.93 | 11.91 | | 12 day SMA | 11.96 | 12.01 | 12.16 | | 20 day SMA | 12.04 | 12.04 | 12.08 | | 35 day SMA | 13.22 | 13.22 | 13.23 | | 50 day SMA | 12.96 | 12.96 | 12.96 | | 100 day SMA | 10.28 | 10.22 | 10.17 | | 150 day SMA | 8.75 | 8.7 | 8.66 | | 200 day SMA | 7.91 | 7.88 | 7.84 |
|
|
