TciExpress TCIEXP full analysis,charts,indicators,moving averages,SMA,DMA,EMA,ADX,MACD,RSITci Express TCIEXP WideScreen charts, DMA,SMA,EMA technical analysis, forecast prediction, by indicators ADX,MACD,RSI,CCI NSE stock exchange
Daily price and charts and targets TciExpress Strong Daily Stock price targets for TciExpress TCIEXP are 654.35 and 671.6 | Daily Target 1 | 651 | | Daily Target 2 | 657.7 | | Daily Target 3 | 668.25 | | Daily Target 4 | 674.95 | | Daily Target 5 | 685.5 |
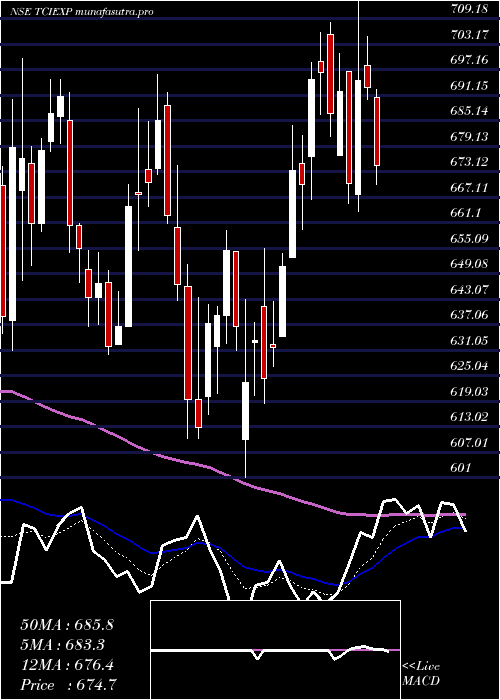
Daily price and volume Tci Express
| Date |
Closing |
Open |
Range |
Volume |
Tue 28 October 2025 |
664.40 (-1.09%) |
676.40 |
661.55 - 678.80 |
0.5275 times |
Mon 27 October 2025 |
671.70 (0.59%) |
666.10 |
666.10 - 682.20 |
0.5493 times |
Fri 24 October 2025 |
667.75 (-0.11%) |
668.50 |
665.10 - 671.80 |
0.2843 times |
Thu 23 October 2025 |
668.50 (-1.71%) |
681.00 |
665.95 - 685.00 |
1.079 times |
Tue 21 October 2025 |
680.10 (0.38%) |
680.00 |
672.35 - 682.50 |
0.1265 times |
Mon 20 October 2025 |
677.55 (0.8%) |
675.70 |
666.75 - 681.50 |
4.0046 times |
Fri 17 October 2025 |
672.15 (-1.53%) |
682.60 |
662.65 - 684.10 |
0.6874 times |
Thu 16 October 2025 |
682.60 (0.2%) |
681.30 |
672.20 - 705.00 |
0.6239 times |
Wed 15 October 2025 |
681.25 (4.37%) |
652.75 |
652.75 - 684.95 |
0.8797 times |
Tue 14 October 2025 |
652.75 (-2.11%) |
666.85 |
650.00 - 673.50 |
1.2378 times |
Mon 13 October 2025 |
666.85 (-2.49%) |
681.90 |
665.15 - 684.55 |
1.1039 times |
Weekly price and charts TciExpress Strong weekly Stock price targets for TciExpress TCIEXP are 652.65 and 673.3 | Weekly Target 1 | 648.73 | | Weekly Target 2 | 656.57 | | Weekly Target 3 | 669.38333333333 | | Weekly Target 4 | 677.22 | | Weekly Target 5 | 690.03 |
Weekly price and volumes for Tci Express
| Date |
Closing |
Open |
Range |
Volume |
Tue 28 October 2025 |
664.40 (-0.5%) |
666.10 |
661.55 - 682.20 |
0.2063 times |
Fri 24 October 2025 |
667.75 (-0.65%) |
675.70 |
665.10 - 685.00 |
1.0528 times |
Fri 17 October 2025 |
672.15 (-1.72%) |
681.90 |
650.00 - 705.00 |
0.8685 times |
Fri 10 October 2025 |
683.90 (-6.54%) |
723.00 |
679.60 - 732.95 |
0.7147 times |
Fri 03 October 2025 |
731.75 (1.26%) |
726.50 |
720.00 - 746.75 |
0.708 times |
Fri 26 September 2025 |
722.65 (1.67%) |
710.75 |
703.65 - 780.00 |
2.5199 times |
Fri 19 September 2025 |
710.75 (0.59%) |
705.30 |
688.00 - 729.90 |
1.9884 times |
Fri 12 September 2025 |
706.60 (-1.9%) |
720.25 |
703.20 - 726.45 |
0.5202 times |
Fri 05 September 2025 |
720.25 (5.48%) |
679.05 |
678.65 - 728.00 |
1.0531 times |
Fri 29 August 2025 |
682.85 (-1.92%) |
699.75 |
665.00 - 699.75 |
0.368 times |
Fri 22 August 2025 |
696.25 (3.3%) |
677.40 |
674.05 - 708.45 |
0.6834 times |

Monthly price and charts TciExpress Strong monthly Stock price targets for TciExpress TCIEXP are 609.75 and 704.65 | Monthly Target 1 | 591.53 | | Monthly Target 2 | 627.97 | | Monthly Target 3 | 686.43333333333 | | Monthly Target 4 | 722.87 | | Monthly Target 5 | 781.33 |
Monthly price and volumes Tci Express
| Date |
Closing |
Open |
Range |
Volume |
Tue 28 October 2025 |
664.40 (-9.57%) |
736.90 |
650.00 - 744.90 |
0.5969 times |
Tue 30 September 2025 |
734.70 (7.59%) |
679.05 |
678.65 - 780.00 |
1.2651 times |
Fri 29 August 2025 |
682.85 (-2.87%) |
705.90 |
655.15 - 730.40 |
0.551 times |
Thu 31 July 2025 |
703.05 (-7.58%) |
764.60 |
651.50 - 778.80 |
0.4726 times |
Mon 30 June 2025 |
760.75 (-0.07%) |
760.00 |
732.20 - 848.00 |
1.798 times |
Fri 30 May 2025 |
761.30 (12.84%) |
670.00 |
645.00 - 780.00 |
0.8406 times |
Wed 30 April 2025 |
674.65 (10.1%) |
620.25 |
601.00 - 718.00 |
0.7584 times |
Fri 28 March 2025 |
612.75 (-9.74%) |
668.65 |
610.20 - 699.85 |
1.6896 times |
Fri 28 February 2025 |
678.85 (-12.51%) |
781.00 |
631.10 - 810.00 |
0.935 times |
Fri 31 January 2025 |
775.95 (-4.58%) |
817.30 |
721.00 - 849.30 |
1.0929 times |
Tue 31 December 2024 |
813.20 (-3.04%) |
840.05 |
810.00 - 899.00 |
1.5924 times |

DMA SMA EMA moving averages of Tci Express TCIEXP
DMA (daily moving average) of Tci Express TCIEXP
| DMA period | DMA value | | 5 day DMA | 670.49 | | 12 day DMA | 672.46 | | 20 day DMA | 690.33 | | 35 day DMA | 701.82 | | 50 day DMA | 699.6 | | 100 day DMA | 717.89 | | 150 day DMA | 709.74 | | 200 day DMA | 715.34 | EMA (exponential moving average) of Tci Express TCIEXP
| EMA period | EMA current | EMA prev | EMA prev2 | | 5 day EMA | 669.62 | 672.23 | 672.5 | | 12 day EMA | 677.03 | 679.32 | 680.71 | | 20 day EMA | 684.49 | 686.6 | 688.17 | | 35 day EMA | 689.23 | 690.69 | 691.81 | | 50 day EMA | 694.45 | 695.68 | 696.66 |
SMA (simple moving average) of Tci Express TCIEXP
| SMA period | SMA current | SMA prev | SMA prev2 | | 5 day SMA | 670.49 | 673.12 | 673.21 | | 12 day SMA | 672.46 | 673.92 | 675.81 | | 20 day SMA | 690.33 | 693.24 | 696.28 | | 35 day SMA | 701.82 | 703.42 | 704.61 | | 50 day SMA | 699.6 | 699.9 | 699.82 | | 100 day SMA | 717.89 | 719.48 | 720.82 | | 150 day SMA | 709.74 | 709.74 | 709.51 | | 200 day SMA | 715.34 | 716.1 | 716.97 |
|
|
