TransportCorporation TCI full analysis,charts,indicators,moving averages,SMA,DMA,EMA,ADX,MACD,RSITransport Corporation TCI WideScreen charts, DMA,SMA,EMA technical analysis, forecast prediction, by indicators ADX,MACD,RSI,CCI NSE stock exchange
operates under Surface Transportation sector
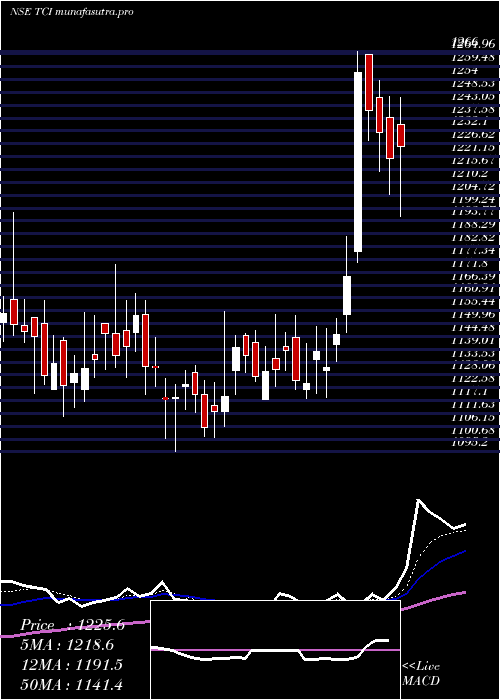
Daily price and charts and targets TransportCorporation Strong Daily Stock price targets for TransportCorporation TCI are 1206.75 and 1262.85 | Daily Target 1 | 1162.4 | | Daily Target 2 | 1195 | | Daily Target 3 | 1218.5 | | Daily Target 4 | 1251.1 | | Daily Target 5 | 1274.6 |
Daily price and volume Transport Corporation
| Date |
Closing |
Open |
Range |
Volume |
Wed 29 October 2025 |
1227.60 (3.52%) |
1185.90 |
1185.90 - 1242.00 |
4.0181 times |
Tue 28 October 2025 |
1185.90 (0.27%) |
1182.60 |
1175.00 - 1193.00 |
0.7671 times |
Mon 27 October 2025 |
1182.70 (-0.36%) |
1187.00 |
1176.30 - 1198.00 |
0.5718 times |
Fri 24 October 2025 |
1187.00 (-0.62%) |
1218.00 |
1180.00 - 1219.90 |
1.016 times |
Thu 23 October 2025 |
1194.40 (-0.73%) |
1192.00 |
1192.00 - 1217.30 |
0.6296 times |
Tue 21 October 2025 |
1203.20 (0.28%) |
1204.00 |
1195.20 - 1216.80 |
0.1377 times |
Mon 20 October 2025 |
1199.80 (0.9%) |
1178.00 |
1178.00 - 1204.90 |
0.7106 times |
Fri 17 October 2025 |
1189.10 (-0.24%) |
1181.50 |
1181.50 - 1198.40 |
0.407 times |
Thu 16 October 2025 |
1192.00 (0.9%) |
1186.10 |
1151.40 - 1198.00 |
1.0402 times |
Wed 15 October 2025 |
1181.40 (-1.54%) |
1210.50 |
1175.00 - 1210.50 |
0.702 times |
Tue 14 October 2025 |
1199.90 (0.03%) |
1210.00 |
1173.00 - 1210.00 |
1.0749 times |
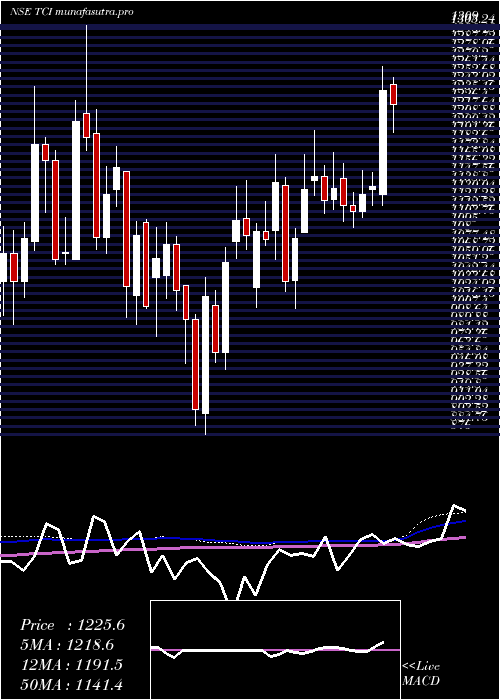
Weekly price and charts TransportCorporation Strong weekly Stock price targets for TransportCorporation TCI are 1201.3 and 1268.3 | Weekly Target 1 | 1147.87 | | Weekly Target 2 | 1187.73 | | Weekly Target 3 | 1214.8666666667 | | Weekly Target 4 | 1254.73 | | Weekly Target 5 | 1281.87 |
Weekly price and volumes for Transport Corporation
| Date |
Closing |
Open |
Range |
Volume |
Wed 29 October 2025 |
1227.60 (3.42%) |
1187.00 |
1175.00 - 1242.00 |
0.956 times |
Fri 24 October 2025 |
1187.00 (-0.18%) |
1178.00 |
1178.00 - 1219.90 |
0.445 times |
Fri 17 October 2025 |
1189.10 (-0.83%) |
1188.30 |
1151.40 - 1210.50 |
0.7149 times |
Fri 10 October 2025 |
1199.00 (-1.44%) |
1230.00 |
1178.30 - 1234.50 |
1.2672 times |
Fri 03 October 2025 |
1216.50 (1.66%) |
1207.00 |
1170.00 - 1223.50 |
0.787 times |
Fri 26 September 2025 |
1196.60 (2.47%) |
1188.00 |
1137.00 - 1217.70 |
2.2354 times |
Fri 19 September 2025 |
1167.80 (0.98%) |
1150.00 |
1141.00 - 1205.00 |
0.8428 times |
Fri 12 September 2025 |
1156.50 (0.57%) |
1150.00 |
1140.40 - 1194.00 |
0.8975 times |
Fri 05 September 2025 |
1150.00 (0.94%) |
1149.50 |
1119.00 - 1184.90 |
0.9733 times |
Fri 29 August 2025 |
1139.30 (-1.44%) |
1156.00 |
1100.00 - 1166.00 |
0.8808 times |
Fri 22 August 2025 |
1156.00 (2.16%) |
1141.50 |
1124.70 - 1185.00 |
0.9953 times |
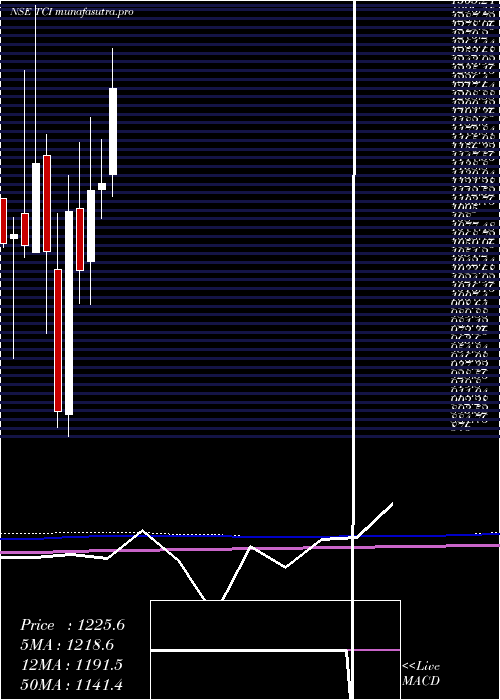
Monthly price and charts TransportCorporation Strong monthly Stock price targets for TransportCorporation TCI are 1189.5 and 1280.1 | Monthly Target 1 | 1116.4 | | Monthly Target 2 | 1172 | | Monthly Target 3 | 1207 | | Monthly Target 4 | 1262.6 | | Monthly Target 5 | 1297.6 |
Monthly price and volumes Transport Corporation
| Date |
Closing |
Open |
Range |
Volume |
Wed 29 October 2025 |
1227.60 (3.92%) |
1180.00 |
1151.40 - 1242.00 |
0.6078 times |
Tue 30 September 2025 |
1181.30 (3.69%) |
1149.50 |
1119.00 - 1217.70 |
0.8666 times |
Fri 29 August 2025 |
1139.30 (-2.87%) |
1179.00 |
1100.00 - 1189.80 |
0.5506 times |
Thu 31 July 2025 |
1173.00 (3.79%) |
1140.00 |
1118.00 - 1289.00 |
1.8586 times |
Mon 30 June 2025 |
1130.20 (0.58%) |
1125.00 |
1095.20 - 1175.00 |
0.7619 times |
Fri 30 May 2025 |
1123.70 (7.77%) |
1052.00 |
1009.00 - 1197.20 |
0.8029 times |
Wed 30 April 2025 |
1042.70 (-5.42%) |
1105.00 |
1010.25 - 1172.00 |
0.8287 times |
Fri 28 March 2025 |
1102.50 (22.24%) |
898.00 |
876.00 - 1138.55 |
1.4643 times |
Fri 28 February 2025 |
901.90 (-15.11%) |
1044.20 |
885.00 - 1100.00 |
0.776 times |
Fri 31 January 2025 |
1062.40 (-7.66%) |
1158.30 |
980.00 - 1180.25 |
1.4827 times |
Tue 31 December 2024 |
1150.50 (7.66%) |
1061.15 |
1061.15 - 1309.00 |
1.541 times |
DMA SMA EMA moving averages of Transport Corporation TCI
DMA (daily moving average) of Transport Corporation TCI
| DMA period | DMA value | | 5 day DMA | 1195.52 | | 12 day DMA | 1195.22 | | 20 day DMA | 1198.1 | | 35 day DMA | 1190.49 | | 50 day DMA | 1179.51 | | 100 day DMA | 1171.57 | | 150 day DMA | 1149.17 | | 200 day DMA | 1116.3 | EMA (exponential moving average) of Transport Corporation TCI
| EMA period | EMA current | EMA prev | EMA prev2 | | 5 day EMA | 1201.51 | 1188.47 | 1189.75 | | 12 day EMA | 1197.3 | 1191.79 | 1192.86 | | 20 day EMA | 1194.74 | 1191.28 | 1191.85 | | 35 day EMA | 1186.49 | 1184.07 | 1183.96 | | 50 day EMA | 1177.68 | 1175.64 | 1175.22 |
SMA (simple moving average) of Transport Corporation TCI
| SMA period | SMA current | SMA prev | SMA prev2 | | 5 day SMA | 1195.52 | 1190.64 | 1193.42 | | 12 day SMA | 1195.22 | 1192.83 | 1193.18 | | 20 day SMA | 1198.1 | 1196.55 | 1197.09 | | 35 day SMA | 1190.49 | 1188.79 | 1187.77 | | 50 day SMA | 1179.51 | 1177.59 | 1176.53 | | 100 day SMA | 1171.57 | 1170.75 | 1170.24 | | 150 day SMA | 1149.17 | 1148.02 | 1146.68 | | 200 day SMA | 1116.3 | 1115.73 | 1115.41 |
|
|
