TribhovandasBhimji TBZ full analysis,charts,indicators,moving averages,SMA,DMA,EMA,ADX,MACD,RSITribhovandas Bhimji TBZ WideScreen charts, DMA,SMA,EMA technical analysis, forecast prediction, by indicators ADX,MACD,RSI,CCI NSE stock exchange
operates under Other Apparels & Accessories sector
Daily price and charts and targets TribhovandasBhimji Strong Daily Stock price targets for TribhovandasBhimji TBZ are 179.36 and 182.7 | Daily Target 1 | 178.76 | | Daily Target 2 | 179.95 | | Daily Target 3 | 182.09666666667 | | Daily Target 4 | 183.29 | | Daily Target 5 | 185.44 |
Daily price and volume Tribhovandas Bhimji
| Date |
Closing |
Open |
Range |
Volume |
Tue 28 October 2025 |
181.15 (-0.82%) |
182.89 |
180.90 - 184.24 |
0.6902 times |
Mon 27 October 2025 |
182.65 (-0.07%) |
183.97 |
182.00 - 184.49 |
0.6156 times |
Fri 24 October 2025 |
182.78 (-0.48%) |
183.66 |
182.25 - 184.66 |
0.6832 times |
Thu 23 October 2025 |
183.66 (-0.26%) |
188.00 |
183.05 - 188.00 |
0.9127 times |
Tue 21 October 2025 |
184.13 (-0.11%) |
185.85 |
182.42 - 185.85 |
0.3418 times |
Mon 20 October 2025 |
184.33 (0.35%) |
184.24 |
182.20 - 185.01 |
0.6613 times |
Fri 17 October 2025 |
183.68 (-2.34%) |
188.10 |
182.98 - 191.85 |
2.0979 times |
Thu 16 October 2025 |
188.09 (0.96%) |
187.00 |
186.51 - 191.15 |
1.6879 times |
Wed 15 October 2025 |
186.31 (0.94%) |
185.20 |
184.95 - 188.10 |
1.2838 times |
Tue 14 October 2025 |
184.57 (0.28%) |
184.05 |
183.26 - 187.24 |
1.0256 times |
Mon 13 October 2025 |
184.05 (-0.49%) |
185.04 |
183.00 - 186.80 |
0.8639 times |
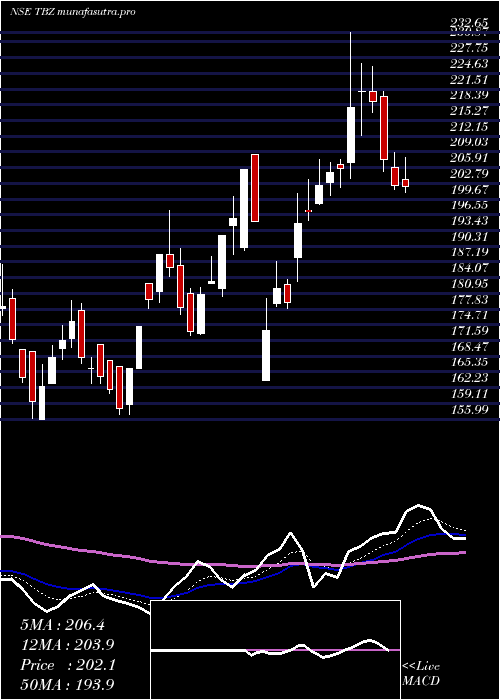
Weekly price and charts TribhovandasBhimji Strong weekly Stock price targets for TribhovandasBhimji TBZ are 179.23 and 182.82 | Weekly Target 1 | 178.59 | | Weekly Target 2 | 179.87 | | Weekly Target 3 | 182.18 | | Weekly Target 4 | 183.46 | | Weekly Target 5 | 185.77 |
Weekly price and volumes for Tribhovandas Bhimji
| Date |
Closing |
Open |
Range |
Volume |
Tue 28 October 2025 |
181.15 (-0.89%) |
183.97 |
180.90 - 184.49 |
0.195 times |
Fri 24 October 2025 |
182.78 (-0.49%) |
184.24 |
182.20 - 188.00 |
0.3881 times |
Fri 17 October 2025 |
183.68 (-0.69%) |
185.04 |
182.98 - 191.85 |
1.0393 times |
Fri 10 October 2025 |
184.96 (-1.9%) |
189.45 |
183.90 - 191.86 |
0.9432 times |
Fri 03 October 2025 |
188.54 (4.21%) |
182.70 |
180.30 - 189.70 |
0.7097 times |
Fri 26 September 2025 |
180.93 (-3.77%) |
188.25 |
179.21 - 191.58 |
0.8816 times |
Fri 19 September 2025 |
188.01 (0.62%) |
187.00 |
186.40 - 197.20 |
3.0641 times |
Fri 12 September 2025 |
186.85 (1.81%) |
183.84 |
183.61 - 192.53 |
1.1573 times |
Fri 05 September 2025 |
183.53 (-0.96%) |
188.50 |
183.01 - 191.79 |
0.922 times |
Fri 29 August 2025 |
185.31 (-2.76%) |
192.43 |
183.64 - 193.00 |
0.6997 times |
Fri 22 August 2025 |
190.56 (1.32%) |
191.90 |
188.50 - 195.89 |
1.1415 times |
Monthly price and charts TribhovandasBhimji Strong monthly Stock price targets for TribhovandasBhimji TBZ are 175.55 and 186.51 | Monthly Target 1 | 173.68 | | Monthly Target 2 | 177.41 | | Monthly Target 3 | 184.63666666667 | | Monthly Target 4 | 188.37 | | Monthly Target 5 | 195.6 |
Monthly price and volumes Tribhovandas Bhimji
| Date |
Closing |
Open |
Range |
Volume |
Tue 28 October 2025 |
181.15 (-0.53%) |
182.00 |
180.90 - 191.86 |
0.3634 times |
Tue 30 September 2025 |
182.12 (-1.72%) |
188.50 |
179.21 - 197.20 |
0.7535 times |
Fri 29 August 2025 |
185.31 (1.06%) |
184.19 |
183.61 - 217.95 |
1.9202 times |
Thu 31 July 2025 |
183.36 (-1.98%) |
187.00 |
182.21 - 209.20 |
1.4102 times |
Mon 30 June 2025 |
187.07 (-0.72%) |
189.45 |
182.01 - 205.91 |
0.826 times |
Fri 30 May 2025 |
188.42 (-3.63%) |
196.20 |
181.55 - 214.30 |
0.8442 times |
Wed 30 April 2025 |
195.52 (6.67%) |
182.01 |
163.64 - 232.65 |
1.5102 times |
Fri 28 March 2025 |
183.30 (11.54%) |
169.50 |
155.99 - 197.37 |
0.5444 times |
Fri 28 February 2025 |
164.33 (-12.09%) |
190.51 |
163.18 - 201.90 |
0.6534 times |
Fri 31 January 2025 |
186.93 (-20.95%) |
236.10 |
167.63 - 258.80 |
1.1746 times |
Tue 31 December 2024 |
236.46 (1.2%) |
234.84 |
231.20 - 292.00 |
1.0512 times |

DMA SMA EMA moving averages of Tribhovandas Bhimji TBZ
DMA (daily moving average) of Tribhovandas Bhimji TBZ
| DMA period | DMA value | | 5 day DMA | 182.87 | | 12 day DMA | 184.2 | | 20 day DMA | 184.56 | | 35 day DMA | 185.88 | | 50 day DMA | 186.69 | | 100 day DMA | 189.47 | | 150 day DMA | 191.45 | | 200 day DMA | 190.03 | EMA (exponential moving average) of Tribhovandas Bhimji TBZ
| EMA period | EMA current | EMA prev | EMA prev2 | | 5 day EMA | 182.68 | 183.45 | 183.85 | | 12 day EMA | 183.82 | 184.31 | 184.61 | | 20 day EMA | 184.57 | 184.93 | 185.17 | | 35 day EMA | 185.65 | 185.92 | 186.11 | | 50 day EMA | 186.66 | 186.88 | 187.05 |
SMA (simple moving average) of Tribhovandas Bhimji TBZ
| SMA period | SMA current | SMA prev | SMA prev2 | | 5 day SMA | 182.87 | 183.51 | 183.72 | | 12 day SMA | 184.2 | 184.69 | 184.91 | | 20 day SMA | 184.56 | 184.55 | 184.69 | | 35 day SMA | 185.88 | 185.94 | 186.01 | | 50 day SMA | 186.69 | 186.82 | 186.97 | | 100 day SMA | 189.47 | 189.53 | 189.55 | | 150 day SMA | 191.45 | 191.4 | 191.29 | | 200 day SMA | 190.03 | 190.3 | 190.64 |
|
|
