TastyBite TASTYBITE full analysis,charts,indicators,moving averages,SMA,DMA,EMA,ADX,MACD,RSITasty Bite TASTYBITE WideScreen charts, DMA,SMA,EMA technical analysis, forecast prediction, by indicators ADX,MACD,RSI,CCI NSE stock exchange
Daily price and charts and targets TastyBite Strong Daily Stock price targets for TastyBite TASTYBITE are 8714.75 and 9099.25 | Daily Target 1 | 8633.5 | | Daily Target 2 | 8796 | | Daily Target 3 | 9018 | | Daily Target 4 | 9180.5 | | Daily Target 5 | 9402.5 |
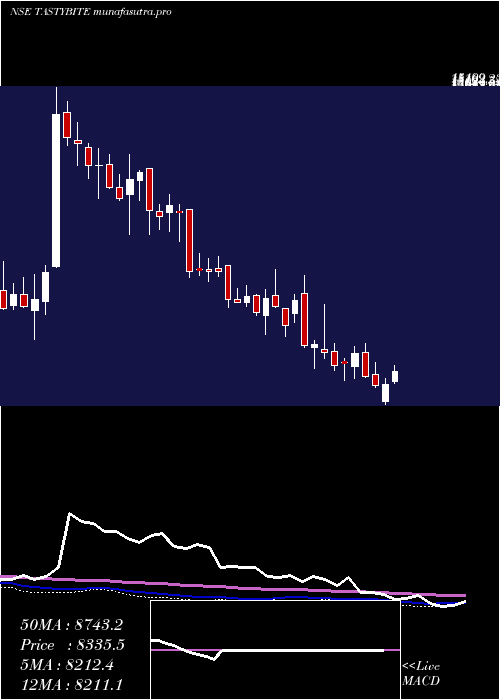
Daily price and volume Tasty Bite
| Date |
Closing |
Open |
Range |
Volume |
Tue 28 October 2025 |
8958.50 (-0.37%) |
9086.50 |
8855.50 - 9240.00 |
2.8674 times |
Mon 27 October 2025 |
8991.50 (-0.09%) |
9052.50 |
8897.50 - 9088.00 |
0.42 times |
Fri 24 October 2025 |
9000.00 (-1.9%) |
9174.50 |
8950.00 - 9309.50 |
0.7255 times |
Thu 23 October 2025 |
9174.00 (0.17%) |
9280.00 |
9158.00 - 9296.00 |
1.0696 times |
Tue 21 October 2025 |
9158.00 (1.27%) |
9290.00 |
9056.00 - 9319.00 |
0.6942 times |
Mon 20 October 2025 |
9043.00 (0.57%) |
9090.00 |
9008.00 - 9142.00 |
0.3974 times |
Fri 17 October 2025 |
8991.50 (0.85%) |
9000.00 |
8908.00 - 9240.00 |
1.6933 times |
Thu 16 October 2025 |
8915.50 (0.89%) |
8838.50 |
8838.50 - 8939.00 |
0.4792 times |
Wed 15 October 2025 |
8837.00 (0.3%) |
8900.00 |
8681.00 - 8900.00 |
0.8606 times |
Tue 14 October 2025 |
8811.00 (-0.13%) |
8980.00 |
8778.00 - 9082.00 |
0.7927 times |
Mon 13 October 2025 |
8822.50 (-0.76%) |
8890.00 |
8798.50 - 8890.00 |
0.3887 times |

Weekly price and charts TastyBite Strong weekly Stock price targets for TastyBite TASTYBITE are 8714.75 and 9099.25 | Weekly Target 1 | 8633.5 | | Weekly Target 2 | 8796 | | Weekly Target 3 | 9018 | | Weekly Target 4 | 9180.5 | | Weekly Target 5 | 9402.5 |
Weekly price and volumes for Tasty Bite
| Date |
Closing |
Open |
Range |
Volume |
Tue 28 October 2025 |
8958.50 (-0.46%) |
9052.50 |
8855.50 - 9240.00 |
0.7602 times |
Fri 24 October 2025 |
9000.00 (0.09%) |
9090.00 |
8950.00 - 9319.00 |
0.6675 times |
Fri 17 October 2025 |
8991.50 (1.14%) |
8890.00 |
8681.00 - 9240.00 |
0.9745 times |
Fri 10 October 2025 |
8890.00 (0.01%) |
8999.00 |
8787.00 - 9320.00 |
1.5442 times |
Fri 03 October 2025 |
8889.50 (-0.58%) |
9013.00 |
8778.00 - 9049.50 |
0.5682 times |
Fri 26 September 2025 |
8941.50 (-4.66%) |
9358.00 |
8847.00 - 9428.50 |
1.0653 times |
Fri 19 September 2025 |
9379.00 (0.67%) |
9321.00 |
9321.00 - 9499.00 |
0.7306 times |
Fri 12 September 2025 |
9317.00 (-2.67%) |
9715.00 |
9155.50 - 10100.00 |
1.7687 times |
Fri 05 September 2025 |
9572.50 (0.51%) |
9549.50 |
9460.50 - 9980.00 |
1.1231 times |
Fri 29 August 2025 |
9524.00 (-2.14%) |
9874.00 |
9482.00 - 9874.00 |
0.7977 times |
Fri 22 August 2025 |
9732.00 (-2.11%) |
10141.00 |
9652.00 - 10161.00 |
2.0528 times |
Monthly price and charts TastyBite Strong monthly Stock price targets for TastyBite TASTYBITE are 8819.75 and 9458.75 | Monthly Target 1 | 8347.5 | | Monthly Target 2 | 8653 | | Monthly Target 3 | 8986.5 | | Monthly Target 4 | 9292 | | Monthly Target 5 | 9625.5 |
Monthly price and volumes Tasty Bite
| Date |
Closing |
Open |
Range |
Volume |
Tue 28 October 2025 |
8958.50 (1.05%) |
8952.50 |
8681.00 - 9320.00 |
0.3738 times |
Tue 30 September 2025 |
8865.00 (-6.92%) |
9549.50 |
8778.00 - 10100.00 |
0.4352 times |
Fri 29 August 2025 |
9524.00 (-16.38%) |
11390.00 |
9482.00 - 11958.00 |
1.1512 times |
Thu 31 July 2025 |
11390.00 (2.51%) |
11162.00 |
10700.00 - 11899.00 |
1.275 times |
Mon 30 June 2025 |
11111.00 (5.49%) |
10649.00 |
10144.00 - 11467.00 |
1.0855 times |
Fri 30 May 2025 |
10533.00 (11.22%) |
9470.00 |
8679.50 - 11043.00 |
1.3966 times |
Wed 30 April 2025 |
9470.00 (15.22%) |
8257.15 |
7543.40 - 9900.00 |
1.186 times |
Fri 28 March 2025 |
8219.20 (-6.56%) |
8812.00 |
8101.85 - 9007.10 |
1.3754 times |
Fri 28 February 2025 |
8795.95 (-6.84%) |
9726.50 |
8412.80 - 10648.00 |
0.9711 times |
Fri 31 January 2025 |
9442.25 (-4.88%) |
9930.00 |
9178.05 - 10800.00 |
0.7502 times |
Tue 31 December 2024 |
9926.60 (-7.98%) |
10787.95 |
9865.00 - 11099.95 |
0.6304 times |

DMA SMA EMA moving averages of Tasty Bite TASTYBITE
DMA (daily moving average) of Tasty Bite TASTYBITE
| DMA period | DMA value | | 5 day DMA | 9056.4 | | 12 day DMA | 8966.04 | | 20 day DMA | 8947.1 | | 35 day DMA | 9101.87 | | 50 day DMA | 9276.93 | | 100 day DMA | 10098.31 | | 150 day DMA | 9812.81 | | 200 day DMA | 9685.32 | EMA (exponential moving average) of Tasty Bite TASTYBITE
| EMA period | EMA current | EMA prev | EMA prev2 | | 5 day EMA | 9005.96 | 9029.69 | 9048.78 | | 12 day EMA | 8999.52 | 9006.98 | 9009.79 | | 20 day EMA | 9032.16 | 9039.91 | 9045 | | 35 day EMA | 9180.95 | 9194.05 | 9205.98 | | 50 day EMA | 9358.16 | 9374.47 | 9390.09 |
SMA (simple moving average) of Tasty Bite TASTYBITE
| SMA period | SMA current | SMA prev | SMA prev2 | | 5 day SMA | 9056.4 | 9073.3 | 9073.3 | | 12 day SMA | 8966.04 | 8954.08 | 8943.25 | | 20 day SMA | 8947.1 | 8946.25 | 8945.13 | | 35 day SMA | 9101.87 | 9119.41 | 9135.36 | | 50 day SMA | 9276.93 | 9303.52 | 9332.13 | | 100 day SMA | 10098.31 | 10113.72 | 10126.76 | | 150 day SMA | 9812.81 | 9809.49 | 9804.56 | | 200 day SMA | 9685.32 | 9690.44 | 9696.23 |
|
|
