TarsonsProducts TARSONS full analysis,charts,indicators,moving averages,SMA,DMA,EMA,ADX,MACD,RSITarsons Products TARSONS WideScreen charts, DMA,SMA,EMA technical analysis, forecast prediction, by indicators ADX,MACD,RSI,CCI NSE stock exchange
Daily price and charts and targets TarsonsProducts Strong Daily Stock price targets for TarsonsProducts TARSONS are 287.43 and 290.13 | Daily Target 1 | 286.88 | | Daily Target 2 | 287.97 | | Daily Target 3 | 289.58333333333 | | Daily Target 4 | 290.67 | | Daily Target 5 | 292.28 |
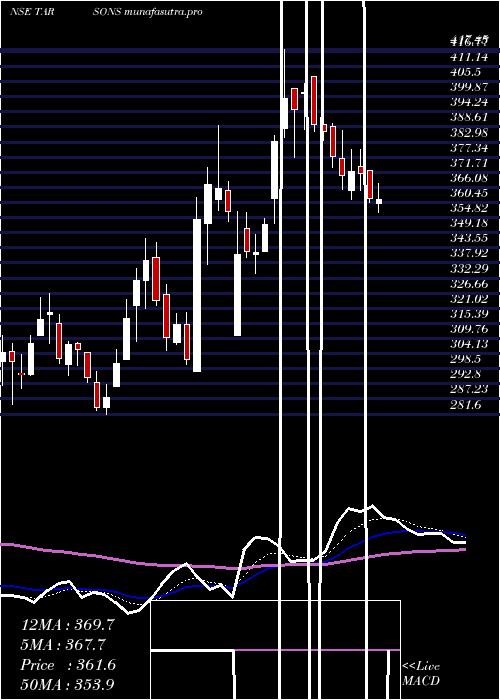
Daily price and volume Tarsons Products
| Date |
Closing |
Open |
Range |
Volume |
Tue 28 October 2025 |
289.05 (-0.28%) |
291.20 |
288.50 - 291.20 |
0.7242 times |
Mon 27 October 2025 |
289.85 (-0.14%) |
292.30 |
288.15 - 292.45 |
1.8523 times |
Fri 24 October 2025 |
290.25 (0.07%) |
291.00 |
288.00 - 291.60 |
1.5159 times |
Thu 23 October 2025 |
290.05 (-0.07%) |
289.00 |
289.00 - 291.70 |
1.7371 times |
Tue 21 October 2025 |
290.25 (0.09%) |
291.40 |
286.00 - 295.50 |
0.6122 times |
Mon 20 October 2025 |
290.00 (-0.29%) |
290.85 |
288.00 - 292.40 |
0.8042 times |
Fri 17 October 2025 |
290.85 (0.14%) |
292.00 |
287.55 - 296.20 |
0.7402 times |
Thu 16 October 2025 |
290.45 (-0.79%) |
293.10 |
289.00 - 294.65 |
0.9191 times |
Wed 15 October 2025 |
292.75 (-0.22%) |
293.95 |
291.50 - 295.50 |
0.5136 times |
Tue 14 October 2025 |
293.40 (-1.51%) |
299.50 |
292.00 - 299.50 |
0.5812 times |
Mon 13 October 2025 |
297.90 (-0.2%) |
297.10 |
294.45 - 299.00 |
0.4299 times |
Weekly price and charts TarsonsProducts Strong weekly Stock price targets for TarsonsProducts TARSONS are 286.45 and 290.75 | Weekly Target 1 | 285.58 | | Weekly Target 2 | 287.32 | | Weekly Target 3 | 289.88333333333 | | Weekly Target 4 | 291.62 | | Weekly Target 5 | 294.18 |
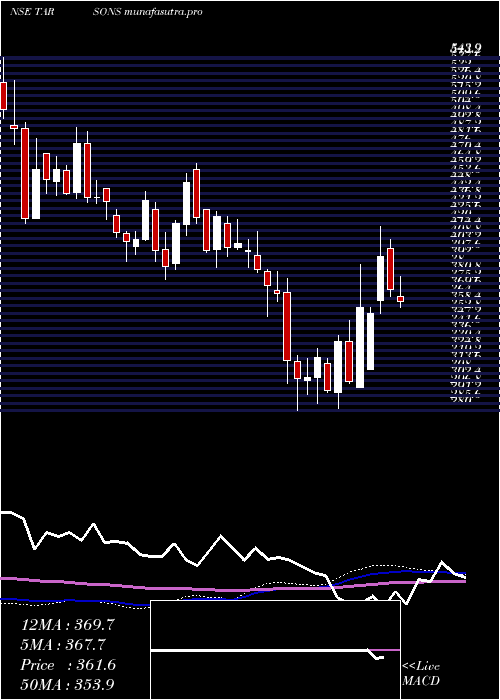
Weekly price and volumes for Tarsons Products
| Date |
Closing |
Open |
Range |
Volume |
Tue 28 October 2025 |
289.05 (-0.41%) |
292.30 |
288.15 - 292.45 |
0.4297 times |
Fri 24 October 2025 |
290.25 (-0.21%) |
290.85 |
286.00 - 295.50 |
0.7788 times |
Fri 17 October 2025 |
290.85 (-2.56%) |
297.10 |
287.55 - 299.50 |
0.5311 times |
Fri 10 October 2025 |
298.50 (-1.87%) |
303.50 |
295.70 - 307.55 |
1.0368 times |
Fri 03 October 2025 |
304.20 (-0.99%) |
305.05 |
303.00 - 310.35 |
0.5531 times |
Fri 26 September 2025 |
307.25 (-0.61%) |
309.00 |
301.80 - 316.80 |
0.9169 times |
Fri 19 September 2025 |
309.15 (-1.21%) |
313.00 |
305.00 - 319.70 |
0.9611 times |
Fri 12 September 2025 |
312.95 (-2.02%) |
329.80 |
312.00 - 329.80 |
0.7851 times |
Fri 05 September 2025 |
319.40 (2.44%) |
313.40 |
312.50 - 330.00 |
1.2025 times |
Fri 29 August 2025 |
311.80 (-4.79%) |
327.50 |
308.60 - 329.95 |
2.805 times |
Fri 22 August 2025 |
327.50 (-4.78%) |
345.15 |
326.25 - 346.00 |
1.088 times |
Monthly price and charts TarsonsProducts Strong monthly Stock price targets for TarsonsProducts TARSONS are 275.55 and 299.5 | Monthly Target 1 | 271.05 | | Monthly Target 2 | 280.05 | | Monthly Target 3 | 295 | | Monthly Target 4 | 304 | | Monthly Target 5 | 318.95 |
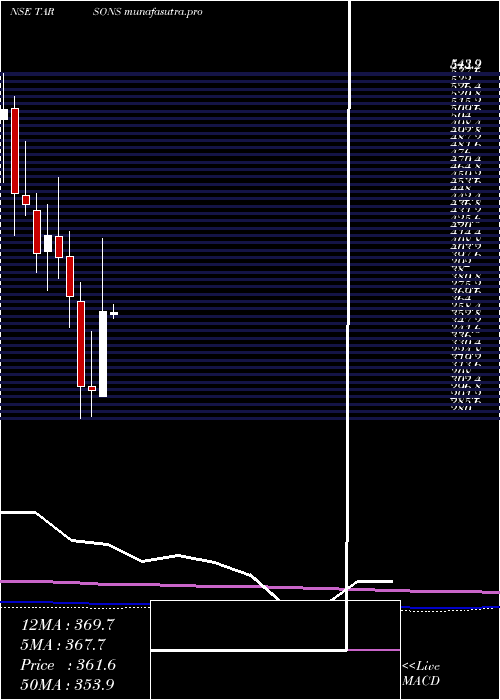
Monthly price and volumes Tarsons Products
| Date |
Closing |
Open |
Range |
Volume |
Tue 28 October 2025 |
289.05 (-5.28%) |
305.00 |
286.00 - 309.95 |
0.426 times |
Tue 30 September 2025 |
305.15 (-2.13%) |
313.40 |
301.80 - 330.00 |
0.5827 times |
Fri 29 August 2025 |
311.80 (-14.74%) |
362.00 |
308.60 - 382.10 |
1.2776 times |
Thu 31 July 2025 |
365.70 (-7.58%) |
395.00 |
357.10 - 402.85 |
0.5823 times |
Mon 30 June 2025 |
395.70 (5.09%) |
376.00 |
361.00 - 402.45 |
0.8944 times |
Fri 30 May 2025 |
376.55 (4.08%) |
360.00 |
346.10 - 458.00 |
1.6663 times |
Wed 30 April 2025 |
361.80 (19.86%) |
297.30 |
297.30 - 417.45 |
1.3525 times |
Fri 28 March 2025 |
301.85 (-0.85%) |
304.95 |
281.60 - 347.00 |
1.3228 times |
Fri 28 February 2025 |
304.45 (-18.48%) |
369.55 |
280.00 - 384.20 |
0.8726 times |
Fri 31 January 2025 |
373.45 (-7.48%) |
404.00 |
350.05 - 422.90 |
1.0227 times |
Tue 31 December 2024 |
403.65 (-3.82%) |
419.00 |
387.00 - 464.30 |
1.4235 times |
DMA SMA EMA moving averages of Tarsons Products TARSONS
DMA (daily moving average) of Tarsons Products TARSONS
| DMA period | DMA value | | 5 day DMA | 289.89 | | 12 day DMA | 291.94 | | 20 day DMA | 296.19 | | 35 day DMA | 303.09 | | 50 day DMA | 309.57 | | 100 day DMA | 343.66 | | 150 day DMA | 352.7 | | 200 day DMA | 351.04 | EMA (exponential moving average) of Tarsons Products TARSONS
| EMA period | EMA current | EMA prev | EMA prev2 | | 5 day EMA | 289.96 | 290.42 | 290.7 | | 12 day EMA | 292.48 | 293.1 | 293.69 | | 20 day EMA | 296.23 | 296.98 | 297.73 | | 35 day EMA | 303.85 | 304.72 | 305.6 | | 50 day EMA | 311.6 | 312.52 | 313.45 |
SMA (simple moving average) of Tarsons Products TARSONS
| SMA period | SMA current | SMA prev | SMA prev2 | | 5 day SMA | 289.89 | 290.08 | 290.28 | | 12 day SMA | 291.94 | 292.69 | 293.29 | | 20 day SMA | 296.19 | 297.1 | 298.06 | | 35 day SMA | 303.09 | 303.95 | 304.89 | | 50 day SMA | 309.57 | 310.68 | 312.08 | | 100 day SMA | 343.66 | 344.61 | 345.5 | | 150 day SMA | 352.7 | 352.77 | 352.76 | | 200 day SMA | 351.04 | 351.61 | 352.17 |
|
|
