Tarmat TARMAT full analysis,charts,indicators,moving averages,SMA,DMA,EMA,ADX,MACD,RSITarmat TARMAT WideScreen charts, DMA,SMA,EMA technical analysis, forecast prediction, by indicators ADX,MACD,RSI,CCI NSE stock exchange
operates under Construction Materials sector
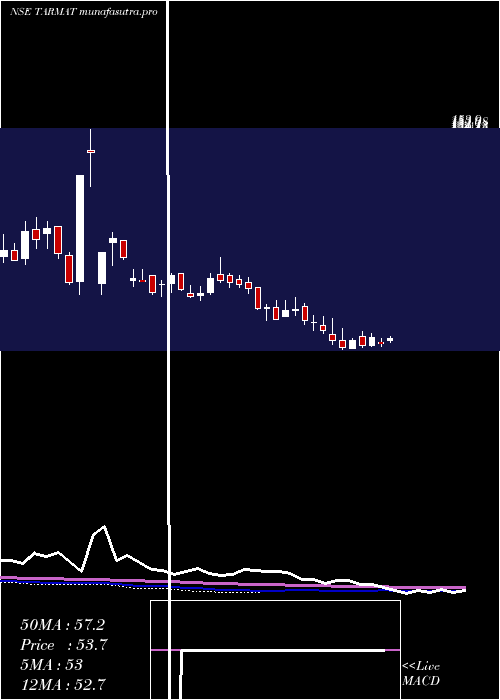
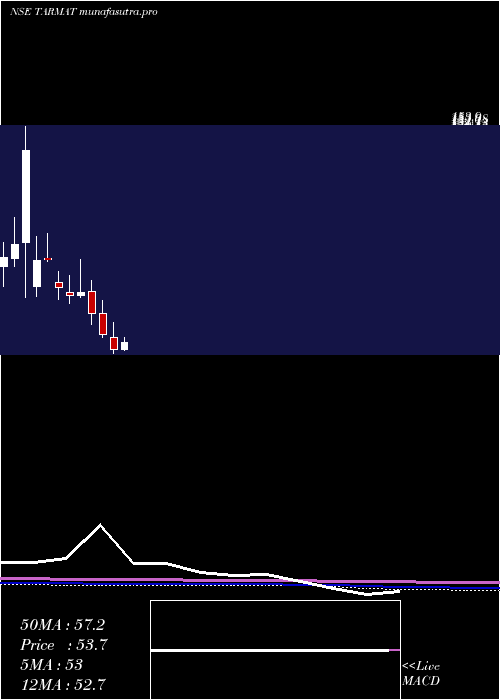
Daily price and charts and targets Tarmat Strong Daily Stock price targets for Tarmat TARMAT are 51.05 and 52.24 | Daily Target 1 | 50.81 | | Daily Target 2 | 51.28 | | Daily Target 3 | 52.003333333333 | | Daily Target 4 | 52.47 | | Daily Target 5 | 53.19 |
Daily price and volume Tarmat
| Date |
Closing |
Open |
Range |
Volume |
Wed 29 October 2025 |
51.74 (-0.5%) |
52.00 |
51.54 - 52.73 |
0.1406 times |
Tue 28 October 2025 |
52.00 (-1.29%) |
53.71 |
51.60 - 54.20 |
0.3631 times |
Mon 27 October 2025 |
52.68 (-2.53%) |
55.40 |
52.26 - 55.40 |
0.1664 times |
Fri 24 October 2025 |
54.05 (0.07%) |
54.80 |
53.76 - 55.41 |
0.1434 times |
Thu 23 October 2025 |
54.01 (-1.76%) |
55.70 |
53.05 - 55.70 |
0.2038 times |
Tue 21 October 2025 |
54.98 (0.83%) |
54.66 |
54.66 - 56.50 |
0.0563 times |
Mon 20 October 2025 |
54.53 (0.91%) |
54.04 |
52.30 - 55.98 |
7.7579 times |
Fri 17 October 2025 |
54.04 (-1.6%) |
54.73 |
53.72 - 54.99 |
0.3937 times |
Thu 16 October 2025 |
54.92 (-0.24%) |
54.84 |
53.71 - 55.71 |
0.3463 times |
Wed 15 October 2025 |
55.05 (2.57%) |
55.28 |
53.63 - 55.50 |
0.4287 times |
Tue 14 October 2025 |
53.67 (-1.49%) |
54.48 |
52.50 - 55.15 |
0.4322 times |

Weekly price and charts Tarmat Strong weekly Stock price targets for Tarmat TARMAT are 49.71 and 53.57 | Weekly Target 1 | 49.03 | | Weekly Target 2 | 50.39 | | Weekly Target 3 | 52.893333333333 | | Weekly Target 4 | 54.25 | | Weekly Target 5 | 56.75 |
Weekly price and volumes for Tarmat
| Date |
Closing |
Open |
Range |
Volume |
Wed 29 October 2025 |
51.74 (-4.27%) |
55.40 |
51.54 - 55.40 |
0.2206 times |
Fri 24 October 2025 |
54.05 (0.02%) |
54.04 |
52.30 - 56.50 |
2.6871 times |
Fri 17 October 2025 |
54.04 (-1.87%) |
55.07 |
52.50 - 55.98 |
0.686 times |
Fri 10 October 2025 |
55.07 (5.16%) |
52.90 |
49.90 - 58.85 |
2.7397 times |
Fri 03 October 2025 |
52.37 (8.14%) |
48.43 |
48.05 - 57.40 |
1.9462 times |
Fri 26 September 2025 |
48.43 (-7.49%) |
53.80 |
47.72 - 53.80 |
0.3448 times |
Fri 19 September 2025 |
52.35 (1.51%) |
52.79 |
50.71 - 53.50 |
0.2822 times |
Fri 12 September 2025 |
51.57 (-0.25%) |
51.01 |
50.56 - 55.76 |
0.4145 times |
Fri 05 September 2025 |
51.70 (3.07%) |
50.18 |
49.71 - 53.90 |
0.3875 times |
Fri 29 August 2025 |
50.16 (-8.68%) |
55.35 |
49.23 - 55.35 |
0.2914 times |
Fri 22 August 2025 |
54.93 (-0.51%) |
56.89 |
54.22 - 58.50 |
0.5053 times |
Monthly price and charts Tarmat Strong monthly Stock price targets for Tarmat TARMAT are 50.82 and 59.77 | Monthly Target 1 | 44.55 | | Monthly Target 2 | 48.14 | | Monthly Target 3 | 53.496666666667 | | Monthly Target 4 | 57.09 | | Monthly Target 5 | 62.45 |
Monthly price and volumes Tarmat
| Date |
Closing |
Open |
Range |
Volume |
Wed 29 October 2025 |
51.74 (1.83%) |
51.10 |
49.90 - 58.85 |
1.9367 times |
Tue 30 September 2025 |
50.81 (1.3%) |
50.18 |
47.72 - 55.76 |
0.4867 times |
Fri 29 August 2025 |
50.16 (-8.55%) |
55.50 |
49.23 - 59.70 |
0.3957 times |
Thu 31 July 2025 |
54.85 (0.7%) |
55.14 |
51.60 - 64.90 |
2.0097 times |
Mon 30 June 2025 |
54.47 (-4.76%) |
58.00 |
51.02 - 60.99 |
0.8484 times |
Fri 30 May 2025 |
57.19 (13.34%) |
51.87 |
45.10 - 60.60 |
1.4018 times |
Wed 30 April 2025 |
50.46 (-0.41%) |
50.67 |
49.97 - 56.80 |
0.3219 times |
Fri 28 March 2025 |
50.67 (-12.26%) |
56.02 |
48.75 - 63.30 |
1.3713 times |
Fri 28 February 2025 |
57.75 (-14.28%) |
67.45 |
56.20 - 73.57 |
0.3881 times |
Fri 31 January 2025 |
67.37 (-12.83%) |
77.49 |
62.33 - 82.44 |
0.8397 times |
Tue 31 December 2024 |
77.29 (2.38%) |
75.89 |
74.80 - 92.59 |
1.0845 times |
DMA SMA EMA moving averages of Tarmat TARMAT
DMA (daily moving average) of Tarmat TARMAT
| DMA period | DMA value | | 5 day DMA | 52.9 | | 12 day DMA | 53.85 | | 20 day DMA | 53.44 | | 35 day DMA | 52.61 | | 50 day DMA | 52.88 | | 100 day DMA | 54.33 | | 150 day DMA | 53.76 | | 200 day DMA | 55.86 | EMA (exponential moving average) of Tarmat TARMAT
| EMA period | EMA current | EMA prev | EMA prev2 | | 5 day EMA | 52.69 | 53.17 | 53.75 | | 12 day EMA | 53.25 | 53.53 | 53.81 | | 20 day EMA | 53.22 | 53.38 | 53.53 | | 35 day EMA | 53.24 | 53.33 | 53.41 | | 50 day EMA | 52.96 | 53.01 | 53.05 |
SMA (simple moving average) of Tarmat TARMAT
| SMA period | SMA current | SMA prev | SMA prev2 | | 5 day SMA | 52.9 | 53.54 | 54.05 | | 12 day SMA | 53.85 | 54.12 | 54.41 | | 20 day SMA | 53.44 | 53.34 | 53.16 | | 35 day SMA | 52.61 | 52.62 | 52.62 | | 50 day SMA | 52.88 | 52.95 | 53.01 | | 100 day SMA | 54.33 | 54.36 | 54.39 | | 150 day SMA | 53.76 | 53.76 | 53.75 | | 200 day SMA | 55.86 | 55.98 | 56.09 |
|
|
