TransRecti TARIL full analysis,charts,indicators,moving averages,SMA,DMA,EMA,ADX,MACD,RSITrans Recti TARIL WideScreen charts, DMA,SMA,EMA technical analysis, forecast prediction, by indicators ADX,MACD,RSI,CCI NSE stock exchange
Daily price and charts and targets TransRecti Strong Daily Stock price targets for TransRecti TARIL are 458.23 and 480.13 | Daily Target 1 | 443.22 | | Daily Target 2 | 451.33 | | Daily Target 3 | 465.11666666667 | | Daily Target 4 | 473.23 | | Daily Target 5 | 487.02 |
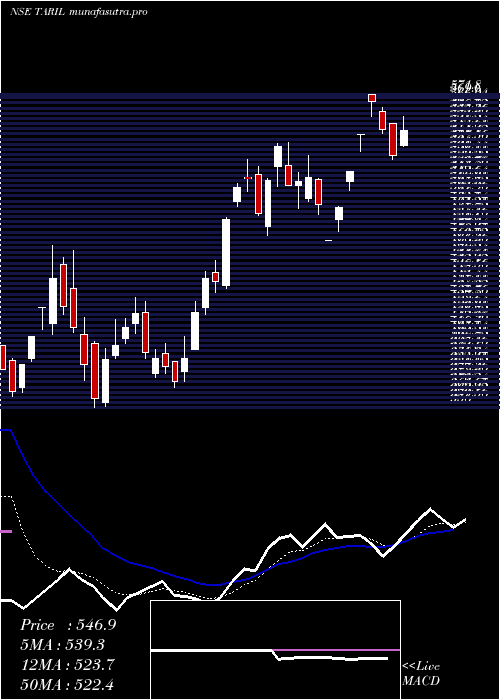
Daily price and volume Trans Recti
| Date |
Closing |
Open |
Range |
Volume |
Wed 29 October 2025 |
459.45 (0.86%) |
458.95 |
457.00 - 478.90 |
2.1997 times |
Tue 28 October 2025 |
455.55 (-3.53%) |
473.00 |
454.05 - 475.00 |
2.5117 times |
Mon 27 October 2025 |
472.20 (-1.83%) |
481.00 |
471.00 - 481.40 |
1.0508 times |
Fri 24 October 2025 |
481.00 (-0.23%) |
482.90 |
478.65 - 483.95 |
0.4139 times |
Thu 23 October 2025 |
482.10 (-0.08%) |
485.25 |
478.95 - 488.00 |
0.6607 times |
Tue 21 October 2025 |
482.50 (0.09%) |
489.40 |
481.25 - 489.40 |
0.2762 times |
Mon 20 October 2025 |
482.05 (-0.43%) |
484.15 |
480.50 - 485.60 |
0.5704 times |
Fri 17 October 2025 |
484.15 (-0.09%) |
484.10 |
480.60 - 489.90 |
0.9082 times |
Thu 16 October 2025 |
484.60 (-0.47%) |
487.70 |
481.00 - 488.85 |
0.8466 times |
Wed 15 October 2025 |
486.90 (1.11%) |
482.30 |
480.85 - 488.85 |
0.5619 times |
Tue 14 October 2025 |
481.55 (-2.25%) |
490.20 |
480.75 - 492.30 |
0.8261 times |
Weekly price and charts TransRecti Strong weekly Stock price targets for TransRecti TARIL are 443.08 and 470.43 | Weekly Target 1 | 437.62 | | Weekly Target 2 | 448.53 | | Weekly Target 3 | 464.96666666667 | | Weekly Target 4 | 475.88 | | Weekly Target 5 | 492.32 |
Weekly price and volumes for Trans Recti
| Date |
Closing |
Open |
Range |
Volume |
Wed 29 October 2025 |
459.45 (-4.48%) |
481.00 |
454.05 - 481.40 |
0.971 times |
Fri 24 October 2025 |
481.00 (-0.65%) |
484.15 |
478.65 - 489.40 |
0.3237 times |
Fri 17 October 2025 |
484.15 (-1.47%) |
486.50 |
471.50 - 495.95 |
0.6934 times |
Fri 10 October 2025 |
491.35 (-1.15%) |
499.00 |
485.00 - 501.20 |
0.5553 times |
Fri 03 October 2025 |
497.05 (-0.25%) |
498.90 |
479.40 - 502.45 |
0.7359 times |
Fri 26 September 2025 |
498.30 (-6.65%) |
536.45 |
496.70 - 552.00 |
1.7915 times |
Fri 19 September 2025 |
533.80 (7.16%) |
498.95 |
497.40 - 536.80 |
1.8997 times |
Fri 12 September 2025 |
498.15 (-1.09%) |
502.95 |
490.35 - 523.20 |
1.6059 times |
Fri 05 September 2025 |
503.65 (2.74%) |
492.85 |
492.35 - 510.35 |
0.7115 times |
Fri 29 August 2025 |
490.20 (-1.75%) |
499.00 |
488.00 - 513.00 |
0.7121 times |
Fri 22 August 2025 |
498.95 (-1.33%) |
513.90 |
496.00 - 517.00 |
0.8137 times |

Monthly price and charts TransRecti Strong monthly Stock price targets for TransRecti TARIL are 433.18 and 480.33 | Monthly Target 1 | 424.42 | | Monthly Target 2 | 441.93 | | Monthly Target 3 | 471.56666666667 | | Monthly Target 4 | 489.08 | | Monthly Target 5 | 518.72 |
Monthly price and volumes Trans Recti
| Date |
Closing |
Open |
Range |
Volume |
Wed 29 October 2025 |
459.45 (-5.56%) |
486.70 |
454.05 - 501.20 |
0.4085 times |
Tue 30 September 2025 |
486.50 (-0.75%) |
492.85 |
479.40 - 552.00 |
0.9392 times |
Fri 29 August 2025 |
490.20 (-4.11%) |
515.05 |
486.30 - 578.50 |
1.3229 times |
Thu 31 July 2025 |
511.20 (4.53%) |
482.20 |
464.00 - 534.00 |
1.0109 times |
Mon 30 June 2025 |
489.05 (-6.24%) |
523.00 |
469.00 - 540.50 |
0.7271 times |
Fri 30 May 2025 |
521.60 (5.38%) |
491.00 |
463.00 - 548.70 |
0.8914 times |
Wed 30 April 2025 |
494.95 (-7.69%) |
522.90 |
470.95 - 594.00 |
1.6831 times |
Fri 28 March 2025 |
536.20 (39.07%) |
400.05 |
356.00 - 538.20 |
1.2753 times |
Fri 28 February 2025 |
385.55 (0%) |
811.10 |
363.60 - 927.45 |
0.7415 times |
Wed 29 October 2025 |
(0%) |
|
- |
0 times |

DMA SMA EMA moving averages of Trans Recti TARIL
DMA (daily moving average) of Trans Recti TARIL
| DMA period | DMA value | | 5 day DMA | 470.06 | | 12 day DMA | 478.73 | | 20 day DMA | 483.84 | | 35 day DMA | 496.99 | | 50 day DMA | 497.83 | | 100 day DMA | 499.86 | | 150 day DMA | 504.72 | | 200 day DMA | | EMA (exponential moving average) of Trans Recti TARIL
| EMA period | EMA current | EMA prev | EMA prev2 | | 5 day EMA | 467.32 | 471.25 | 479.1 | | 12 day EMA | 476.58 | 479.69 | 484.08 | | 20 day EMA | 483.06 | 485.54 | 488.7 | | 35 day EMA | 489.34 | 491.1 | 493.19 | | 50 day EMA | 495.85 | 497.34 | 499.05 |
SMA (simple moving average) of Trans Recti TARIL
| SMA period | SMA current | SMA prev | SMA prev2 | | 5 day SMA | 470.06 | 474.67 | 479.97 | | 12 day SMA | 478.73 | 481.38 | 484.25 | | 20 day SMA | 483.84 | 485.32 | 487.46 | | 35 day SMA | 496.99 | 498.05 | 499.42 | | 50 day SMA | 497.83 | 498.75 | 499.91 | | 100 day SMA | 499.86 | 500.57 | 501.35 | | 150 day SMA | 504.72 | 504.61 | 504.54 | | 200 day SMA |
|
|
