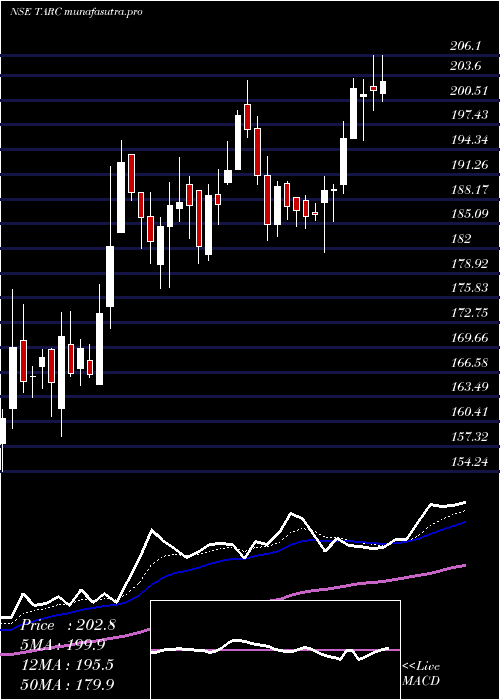
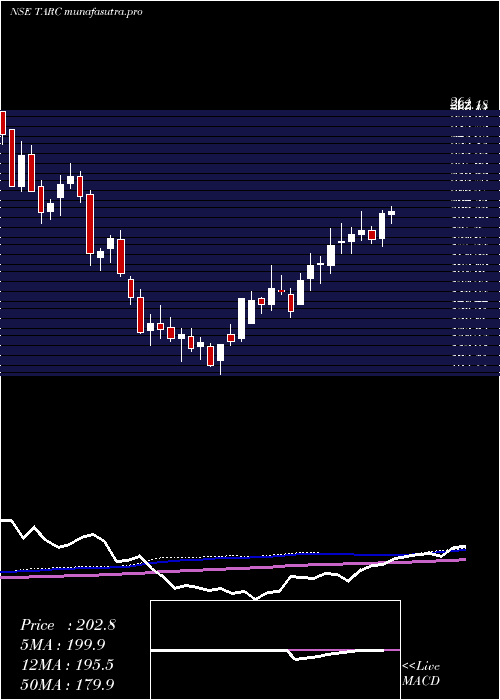
AnantRaj TARC full analysis,charts,indicators,moving averages,SMA,DMA,EMA,ADX,MACD,RSIAnant Raj TARC WideScreen charts, DMA,SMA,EMA technical analysis, forecast prediction, by indicators ADX,MACD,RSI,CCI NSE stock exchange
Daily price and charts and targets AnantRaj Strong Daily Stock price targets for AnantRaj TARC are 140.36 and 145.06 | Daily Target 1 | 139.27 | | Daily Target 2 | 141.45 | | Daily Target 3 | 143.97333333333 | | Daily Target 4 | 146.15 | | Daily Target 5 | 148.67 |
Daily price and volume Anant Raj
| Date |
Closing |
Open |
Range |
Volume |
Wed 29 October 2025 |
143.62 (-0.54%) |
144.60 |
141.80 - 146.50 |
1.3793 times |
Tue 28 October 2025 |
144.40 (-0.87%) |
145.66 |
144.00 - 146.09 |
0.4292 times |
Mon 27 October 2025 |
145.66 (-0.35%) |
146.10 |
143.11 - 147.79 |
0.9626 times |
Fri 24 October 2025 |
146.17 (-0.16%) |
146.10 |
144.18 - 151.29 |
1.4661 times |
Thu 23 October 2025 |
146.41 (-0.16%) |
147.05 |
143.26 - 147.67 |
1.1474 times |
Tue 21 October 2025 |
146.64 (-0.22%) |
147.80 |
144.99 - 147.80 |
0.3311 times |
Mon 20 October 2025 |
146.96 (2.43%) |
144.80 |
141.29 - 147.42 |
1.5544 times |
Fri 17 October 2025 |
143.48 (-1.05%) |
146.10 |
141.50 - 146.10 |
0.7572 times |
Thu 16 October 2025 |
145.00 (-0.39%) |
146.68 |
143.25 - 147.60 |
1.1148 times |
Wed 15 October 2025 |
145.57 (-0.55%) |
146.40 |
143.64 - 147.00 |
0.8578 times |
Tue 14 October 2025 |
146.37 (-1.67%) |
149.00 |
145.21 - 149.35 |
0.7487 times |
Weekly price and charts AnantRaj Strong weekly Stock price targets for AnantRaj TARC are 139.72 and 145.71 | Weekly Target 1 | 138.41 | | Weekly Target 2 | 141.02 | | Weekly Target 3 | 144.40333333333 | | Weekly Target 4 | 147.01 | | Weekly Target 5 | 150.39 |
Weekly price and volumes for Anant Raj
| Date |
Closing |
Open |
Range |
Volume |
Wed 29 October 2025 |
143.62 (-1.74%) |
146.10 |
141.80 - 147.79 |
0.3528 times |
Fri 24 October 2025 |
146.17 (1.87%) |
144.80 |
141.29 - 151.29 |
0.5728 times |
Fri 17 October 2025 |
143.48 (-5.07%) |
152.00 |
141.50 - 152.01 |
0.5426 times |
Fri 10 October 2025 |
151.14 (-5.9%) |
160.09 |
147.91 - 161.69 |
1.1424 times |
Fri 03 October 2025 |
160.62 (-1.25%) |
162.75 |
155.50 - 170.60 |
1.2088 times |
Fri 26 September 2025 |
162.66 (-7.16%) |
175.49 |
158.20 - 176.40 |
0.9349 times |
Fri 19 September 2025 |
175.20 (11.4%) |
158.40 |
157.27 - 179.00 |
1.801 times |
Fri 12 September 2025 |
157.27 (-0.73%) |
159.55 |
153.71 - 161.98 |
0.7853 times |
Fri 05 September 2025 |
158.43 (3.17%) |
154.00 |
153.10 - 165.82 |
1.5082 times |
Fri 29 August 2025 |
153.56 (-3.2%) |
158.63 |
152.50 - 174.00 |
1.1512 times |
Fri 22 August 2025 |
158.63 (-2.36%) |
163.90 |
158.05 - 168.40 |
0.8341 times |
Monthly price and charts AnantRaj Strong monthly Stock price targets for AnantRaj TARC are 132.22 and 152.7 | Monthly Target 1 | 128.41 | | Monthly Target 2 | 136.02 | | Monthly Target 3 | 148.89333333333 | | Monthly Target 4 | 156.5 | | Monthly Target 5 | 169.37 |
Monthly price and volumes Anant Raj
| Date |
Closing |
Open |
Range |
Volume |
Wed 29 October 2025 |
143.62 (-8.52%) |
157.00 |
141.29 - 161.77 |
0.5214 times |
Tue 30 September 2025 |
157.00 (2.24%) |
154.00 |
153.10 - 179.00 |
1.0185 times |
Fri 29 August 2025 |
153.56 (-16.91%) |
182.96 |
152.50 - 187.90 |
0.6684 times |
Thu 31 July 2025 |
184.82 (-0.08%) |
184.96 |
177.86 - 206.10 |
0.8945 times |
Mon 30 June 2025 |
184.96 (8.18%) |
170.00 |
164.89 - 203.00 |
1.522 times |
Fri 30 May 2025 |
170.98 (10.05%) |
155.00 |
137.95 - 176.93 |
0.8657 times |
Wed 30 April 2025 |
155.37 (26.18%) |
125.00 |
123.27 - 170.03 |
1.2211 times |
Fri 28 March 2025 |
123.13 (3.34%) |
120.15 |
103.22 - 133.85 |
1.1224 times |
Fri 28 February 2025 |
119.15 (-11.32%) |
134.20 |
111.21 - 144.95 |
0.9585 times |
Fri 31 January 2025 |
134.36 (-23.9%) |
177.95 |
120.73 - 191.20 |
1.2076 times |
Tue 31 December 2024 |
176.55 (-19.54%) |
219.90 |
166.99 - 232.50 |
1.56 times |
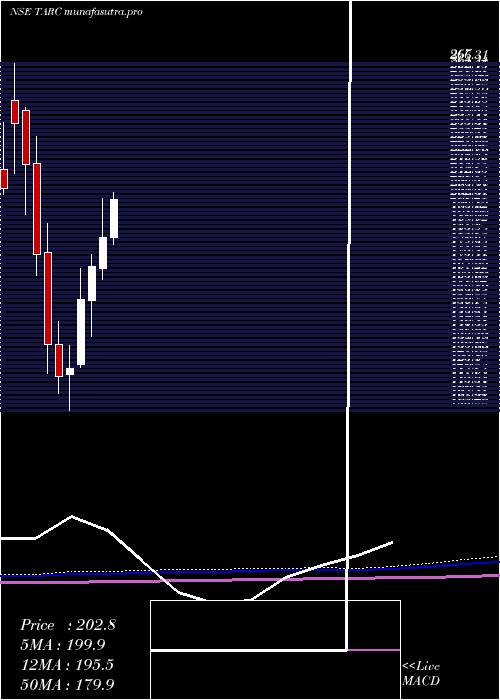
DMA SMA EMA moving averages of Anant Raj TARC
DMA (daily moving average) of Anant Raj TARC
| DMA period | DMA value | | 5 day DMA | 145.25 | | 12 day DMA | 145.76 | | 20 day DMA | 149.75 | | 35 day DMA | 155.86 | | 50 day DMA | 157.38 | | 100 day DMA | 171.92 | | 150 day DMA | 164.97 | | 200 day DMA | 156.24 | EMA (exponential moving average) of Anant Raj TARC
| EMA period | EMA current | EMA prev | EMA prev2 | | 5 day EMA | 144.91 | 145.55 | 146.13 | | 12 day EMA | 146.95 | 147.56 | 148.13 | | 20 day EMA | 149.63 | 150.26 | 150.88 | | 35 day EMA | 152.93 | 153.48 | 154.01 | | 50 day EMA | 156.82 | 157.36 | 157.89 |
SMA (simple moving average) of Anant Raj TARC
| SMA period | SMA current | SMA prev | SMA prev2 | | 5 day SMA | 145.25 | 145.86 | 146.37 | | 12 day SMA | 145.76 | 146.39 | 147.15 | | 20 day SMA | 149.75 | 150.45 | 151.37 | | 35 day SMA | 155.86 | 156.3 | 156.7 | | 50 day SMA | 157.38 | 157.76 | 158.19 | | 100 day SMA | 171.92 | 172.22 | 172.44 | | 150 day SMA | 164.97 | 164.78 | 164.56 | | 200 day SMA | 156.24 | 156.39 | 156.56 |
|
|
