TaraChand TARACHAND full analysis,charts,indicators,moving averages,SMA,DMA,EMA,ADX,MACD,RSITara Chand TARACHAND WideScreen charts, DMA,SMA,EMA technical analysis, forecast prediction, by indicators ADX,MACD,RSI,CCI NSE stock exchange
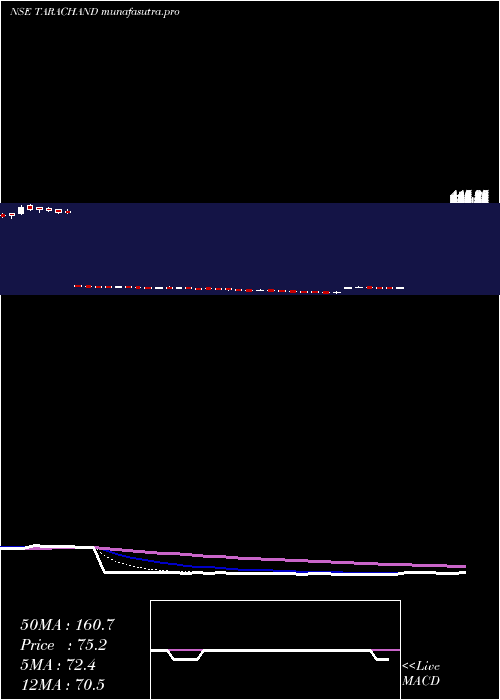
Daily price and charts and targets TaraChand Strong Daily Stock price targets for TaraChand TARACHAND are 89.1 and 99.09 | Daily Target 1 | 81.21 | | Daily Target 2 | 86.99 | | Daily Target 3 | 91.196666666667 | | Daily Target 4 | 96.98 | | Daily Target 5 | 101.19 |
Daily price and volume Tara Chand
| Date |
Closing |
Open |
Range |
Volume |
Wed 29 October 2025 |
92.78 (7.72%) |
87.00 |
85.41 - 95.40 |
2.2487 times |
Tue 28 October 2025 |
86.13 (1.02%) |
85.26 |
85.26 - 88.59 |
0.441 times |
Mon 27 October 2025 |
85.26 (-2.75%) |
88.55 |
84.64 - 88.55 |
0.3903 times |
Fri 24 October 2025 |
87.67 (-0.47%) |
88.49 |
86.55 - 90.95 |
0.5176 times |
Thu 23 October 2025 |
88.08 (-2.92%) |
90.06 |
87.35 - 91.35 |
0.5467 times |
Tue 21 October 2025 |
90.73 (4%) |
87.66 |
87.66 - 92.99 |
0.4394 times |
Mon 20 October 2025 |
87.24 (-3.21%) |
91.00 |
83.55 - 91.50 |
1.6069 times |
Fri 17 October 2025 |
90.13 (-3.69%) |
94.44 |
89.10 - 94.44 |
0.8153 times |
Thu 16 October 2025 |
93.58 (-1.27%) |
94.78 |
90.60 - 96.98 |
1.054 times |
Wed 15 October 2025 |
94.78 (5.7%) |
91.00 |
90.00 - 97.70 |
1.94 times |
Tue 14 October 2025 |
89.67 (-1.69%) |
92.78 |
76.98 - 103.67 |
6.4751 times |
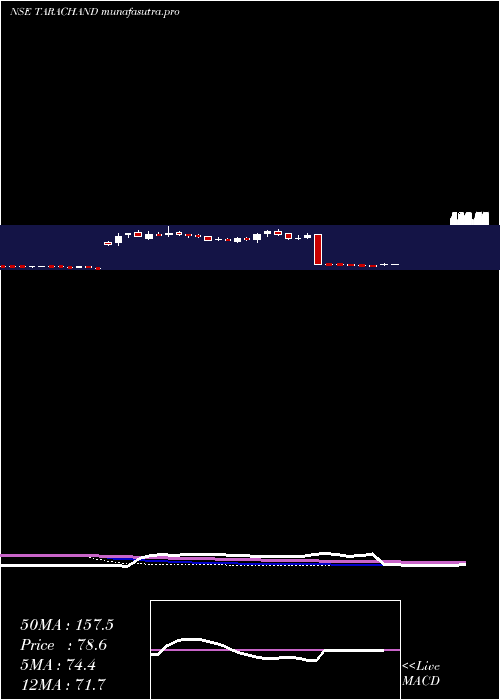
Weekly price and charts TaraChand Strong weekly Stock price targets for TaraChand TARACHAND are 88.71 and 99.47 | Weekly Target 1 | 80.18 | | Weekly Target 2 | 86.48 | | Weekly Target 3 | 90.94 | | Weekly Target 4 | 97.24 | | Weekly Target 5 | 101.7 |
Weekly price and volumes for Tara Chand
| Date |
Closing |
Open |
Range |
Volume |
Wed 29 October 2025 |
92.78 (5.83%) |
88.55 |
84.64 - 95.40 |
0.519 times |
Fri 24 October 2025 |
87.67 (-2.73%) |
91.00 |
83.55 - 92.99 |
0.5242 times |
Fri 17 October 2025 |
90.13 (3.65%) |
87.80 |
76.98 - 103.67 |
2.157 times |
Fri 10 October 2025 |
86.96 (23.28%) |
77.04 |
76.00 - 95.49 |
5.0753 times |
Fri 03 October 2025 |
70.54 (-0.14%) |
70.00 |
67.76 - 71.67 |
0.1801 times |
Fri 26 September 2025 |
70.64 (-1.3%) |
71.57 |
69.51 - 74.01 |
0.4009 times |
Fri 19 September 2025 |
71.57 (4.9%) |
69.50 |
66.75 - 76.77 |
0.5119 times |
Fri 12 September 2025 |
68.23 (-0.45%) |
69.90 |
67.14 - 69.92 |
0.1832 times |
Fri 05 September 2025 |
68.54 (-3.12%) |
71.00 |
67.61 - 73.00 |
0.2552 times |
Fri 29 August 2025 |
70.75 (-2.2%) |
71.50 |
68.00 - 73.84 |
0.1931 times |
Fri 22 August 2025 |
72.34 (-0.62%) |
75.99 |
71.01 - 75.99 |
0.2498 times |
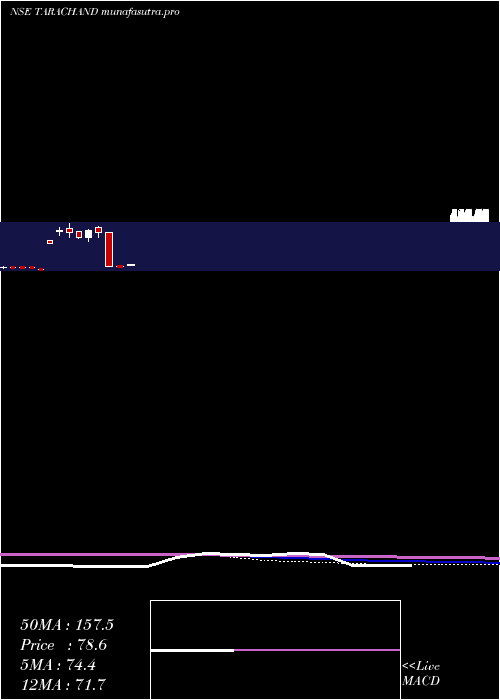
Monthly price and charts TaraChand Strong monthly Stock price targets for TaraChand TARACHAND are 80.39 and 116.06 | Monthly Target 1 | 52.48 | | Monthly Target 2 | 72.63 | | Monthly Target 3 | 88.15 | | Monthly Target 4 | 108.3 | | Monthly Target 5 | 123.82 |
Monthly price and volumes Tara Chand
| Date |
Closing |
Open |
Range |
Volume |
Wed 29 October 2025 |
92.78 (35.84%) |
68.00 |
68.00 - 103.67 |
4.4034 times |
Tue 30 September 2025 |
68.30 (-3.46%) |
71.00 |
66.75 - 76.77 |
0.755 times |
Fri 29 August 2025 |
70.75 (-8.51%) |
78.20 |
68.00 - 81.77 |
0.6215 times |
Thu 31 July 2025 |
77.33 (40.07%) |
71.01 |
68.50 - 82.50 |
1.3354 times |
Fri 10 January 2025 |
55.21 (-8.74%) |
61.00 |
50.91 - 68.67 |
0.9975 times |
Tue 31 December 2024 |
60.50 (-85.69%) |
429.80 |
59.70 - 431.00 |
0.9278 times |
Fri 29 November 2024 |
422.65 (-6.08%) |
480.00 |
367.35 - 488.00 |
0.2201 times |
Thu 31 October 2024 |
450.00 (20.76%) |
368.05 |
332.00 - 458.70 |
0.2812 times |
Mon 30 September 2024 |
372.65 (-12.45%) |
434.00 |
362.00 - 437.00 |
0.1796 times |
Fri 30 August 2024 |
425.65 (-5.34%) |
465.00 |
366.90 - 523.90 |
0.2786 times |
Wed 31 July 2024 |
449.65 (44.81%) |
440.15 |
391.40 - 479.00 |
0.0677 times |
DMA SMA EMA moving averages of Tara Chand TARACHAND
DMA (daily moving average) of Tara Chand TARACHAND
| DMA period | DMA value | | 5 day DMA | 87.98 | | 12 day DMA | 89.77 | | 20 day DMA | 85.52 | | 35 day DMA | 79.15 | | 50 day DMA | 76.67 | | 100 day DMA | 73.62 | | 150 day DMA | 171.92 | | 200 day DMA | 233.72 | EMA (exponential moving average) of Tara Chand TARACHAND
| EMA period | EMA current | EMA prev | EMA prev2 | | 5 day EMA | 89 | 87.11 | 87.6 | | 12 day EMA | 87.74 | 86.82 | 86.94 | | 20 day EMA | 85.42 | 84.65 | 84.49 | | 35 day EMA | 81.86 | 81.22 | 80.93 | | 50 day EMA | 77.48 | 76.86 | 76.48 |
SMA (simple moving average) of Tara Chand TARACHAND
| SMA period | SMA current | SMA prev | SMA prev2 | | 5 day SMA | 87.98 | 87.57 | 87.8 | | 12 day SMA | 89.77 | 89.29 | 88.93 | | 20 day SMA | 85.52 | 84.32 | 83.55 | | 35 day SMA | 79.15 | 78.46 | 77.96 | | 50 day SMA | 76.67 | 76.27 | 75.99 | | 100 day SMA | 73.62 | 73.49 | 73.38 | | 150 day SMA | 171.92 | 173.81 | 175.81 | | 200 day SMA | 233.72 | 235.39 | 237.13 |
|
|
