TankupEngineers TANKUP_ST full analysis,charts,indicators,moving averages,SMA,DMA,EMA,ADX,MACD,RSITankup Engineers TANKUP_ST WideScreen charts, DMA,SMA,EMA technical analysis, forecast prediction, by indicators ADX,MACD,RSI,CCI NSE stock exchange
Daily price and charts and targets TankupEngineers Strong Daily Stock price targets for TankupEngineers TANKUP_ST are 488.55 and 495.65 | Daily Target 1 | 482.63 | | Daily Target 2 | 487.37 | | Daily Target 3 | 489.73333333333 | | Daily Target 4 | 494.47 | | Daily Target 5 | 496.83 |
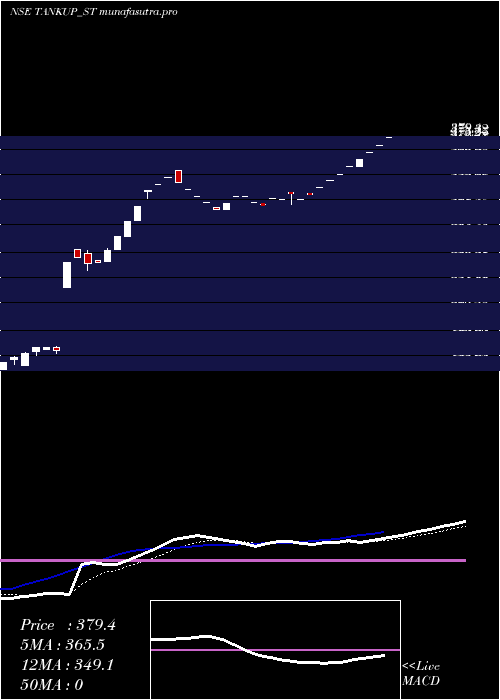
Daily price and volume Tankup Engineers
| Date |
Closing |
Open |
Range |
Volume |
Mon 27 October 2025 |
492.10 (4.99%) |
485.00 |
485.00 - 492.10 |
3.6364 times |
Fri 24 October 2025 |
468.70 (4.84%) |
468.00 |
468.00 - 469.40 |
0.6061 times |
Mon 20 October 2025 |
447.05 (-4.1%) |
447.05 |
447.05 - 447.05 |
0.9091 times |
Fri 17 October 2025 |
466.15 (1.99%) |
466.15 |
466.00 - 466.15 |
1.5152 times |
Thu 16 October 2025 |
457.05 (-1.48%) |
454.65 |
454.65 - 457.05 |
0.6061 times |
Mon 13 October 2025 |
463.90 (-2%) |
468.60 |
463.90 - 468.60 |
0.9091 times |
Fri 10 October 2025 |
473.35 (-2%) |
473.35 |
473.35 - 473.35 |
0.303 times |
Thu 09 October 2025 |
483.00 (-1.83%) |
483.00 |
483.00 - 483.00 |
0.303 times |
Fri 03 October 2025 |
492.00 (1.39%) |
492.00 |
492.00 - 492.00 |
0.9091 times |
Wed 01 October 2025 |
485.25 (-1.95%) |
485.25 |
485.25 - 485.25 |
0.303 times |
Tue 30 September 2025 |
494.90 (1.13%) |
494.90 |
494.90 - 494.90 |
0.6061 times |
Weekly price and charts TankupEngineers Strong weekly Stock price targets for TankupEngineers TANKUP_ST are 488.55 and 495.65 | Weekly Target 1 | 482.63 | | Weekly Target 2 | 487.37 | | Weekly Target 3 | 489.73333333333 | | Weekly Target 4 | 494.47 | | Weekly Target 5 | 496.83 |
Weekly price and volumes for Tankup Engineers
| Date |
Closing |
Open |
Range |
Volume |
Mon 27 October 2025 |
492.10 (4.99%) |
485.00 |
485.00 - 492.10 |
0.8 times |
Fri 24 October 2025 |
468.70 (0.55%) |
447.05 |
447.05 - 469.40 |
0.3333 times |
Fri 17 October 2025 |
466.15 (-1.52%) |
468.60 |
454.65 - 468.60 |
0.6667 times |
Fri 10 October 2025 |
473.35 (-3.79%) |
483.00 |
473.35 - 483.00 |
0.1333 times |
Fri 03 October 2025 |
492.00 (2.54%) |
489.35 |
485.25 - 494.90 |
0.8 times |
Fri 26 September 2025 |
479.80 (5.81%) |
462.50 |
453.10 - 481.10 |
2.4667 times |
Fri 19 September 2025 |
453.45 (10.37%) |
419.05 |
419.05 - 453.45 |
0.8667 times |
Fri 12 September 2025 |
410.85 (11.39%) |
387.25 |
387.25 - 410.85 |
0.9333 times |
Fri 05 September 2025 |
368.85 (11.77%) |
320.45 |
319.95 - 368.85 |
2.4667 times |
Tue 26 August 2025 |
330.00 (1.54%) |
340.00 |
330.00 - 341.25 |
0.5333 times |
Fri 22 August 2025 |
325.00 (1.48%) |
336.25 |
300.05 - 336.25 |
2.1333 times |

Monthly price and charts TankupEngineers Strong monthly Stock price targets for TankupEngineers TANKUP_ST are 469.58 and 514.63 | Monthly Target 1 | 432.03 | | Monthly Target 2 | 462.07 | | Monthly Target 3 | 477.08333333333 | | Monthly Target 4 | 507.12 | | Monthly Target 5 | 522.13 |
Monthly price and volumes Tankup Engineers
| Date |
Closing |
Open |
Range |
Volume |
Mon 27 October 2025 |
492.10 (-0.57%) |
485.25 |
447.05 - 492.10 |
0.14 times |
Tue 30 September 2025 |
494.90 (49.97%) |
320.45 |
319.95 - 494.90 |
0.4624 times |
Tue 26 August 2025 |
330.00 (-7.49%) |
356.70 |
295.00 - 356.70 |
0.3394 times |
Wed 30 July 2025 |
356.70 (11.38%) |
319.05 |
313.50 - 386.95 |
0.5261 times |
Mon 30 June 2025 |
320.25 (24.32%) |
269.95 |
249.50 - 347.15 |
0.9376 times |
Fri 30 May 2025 |
257.60 (40.19%) |
179.00 |
152.55 - 257.60 |
2.0279 times |
Wed 30 April 2025 |
183.75 (0%) |
175.00 |
175.00 - 183.75 |
2.5667 times |
Tue 28 October 2025 |
(0%) |
|
- |
0 times |

DMA SMA EMA moving averages of Tankup Engineers TANKUP_ST
DMA (daily moving average) of Tankup Engineers TANKUP_ST
| DMA period | DMA value | | 5 day DMA | 466.21 | | 12 day DMA | 476.07 | | 20 day DMA | 469.74 | | 35 day DMA | 423.44 | | 50 day DMA | 395.71 | | 100 day DMA | | | 150 day DMA | | | 200 day DMA | | EMA (exponential moving average) of Tankup Engineers TANKUP_ST
| EMA period | EMA current | EMA prev | EMA prev2 | | 5 day EMA | 473.15 | 463.67 | 461.16 | | 12 day EMA | 468.75 | 464.51 | 463.75 | | 20 day EMA | 457.94 | 454.35 | 452.84 | | 35 day EMA | 432.75 | 429.26 | 426.94 | | 50 day EMA | 401.24 | 397.53 | 394.63 |
SMA (simple moving average) of Tankup Engineers TANKUP_ST
| SMA period | SMA current | SMA prev | SMA prev2 | | 5 day SMA | 466.21 | 460.57 | 461.5 | | 12 day SMA | 476.07 | 475.04 | 475.28 | | 20 day SMA | 469.74 | 466.5 | 464.02 | | 35 day SMA | 423.44 | 418.26 | 414.02 | | 50 day SMA | 395.71 | 393.15 | 391.21 | | 100 day SMA | | 150 day SMA | | 200 day SMA |
|
|
