TainwalaChemical TAINWALCHM full analysis,charts,indicators,moving averages,SMA,DMA,EMA,ADX,MACD,RSITainwala Chemical TAINWALCHM WideScreen charts, DMA,SMA,EMA technical analysis, forecast prediction, by indicators ADX,MACD,RSI,CCI NSE stock exchange
operates under Plastic Products sector
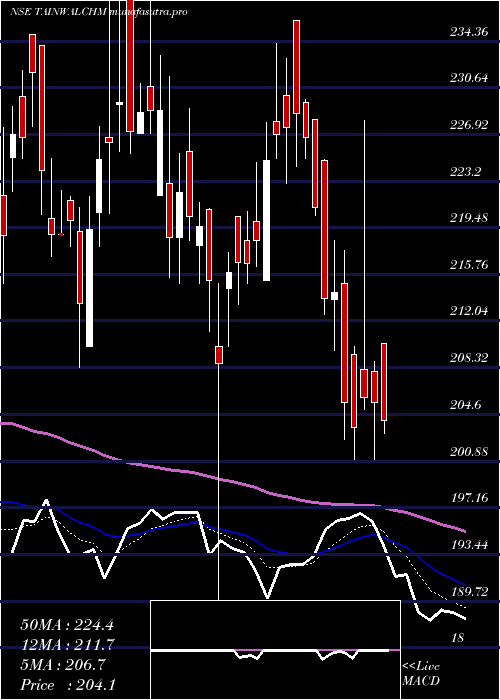
Daily price and charts and targets TainwalaChemical Strong Daily Stock price targets for TainwalaChemical TAINWALCHM are 198.53 and 203.49 | Daily Target 1 | 197.38 | | Daily Target 2 | 199.68 | | Daily Target 3 | 202.33666666667 | | Daily Target 4 | 204.64 | | Daily Target 5 | 207.3 |
Daily price and volume Tainwala Chemical
| Date |
Closing |
Open |
Range |
Volume |
Thu 30 October 2025 |
201.99 (0.62%) |
203.99 |
200.03 - 204.99 |
0.9924 times |
Wed 29 October 2025 |
200.74 (-0.1%) |
205.00 |
200.00 - 205.00 |
0.8673 times |
Tue 28 October 2025 |
200.95 (-0.64%) |
202.25 |
200.03 - 204.84 |
1.137 times |
Mon 27 October 2025 |
202.24 (-1.08%) |
207.65 |
201.00 - 207.65 |
0.9155 times |
Fri 24 October 2025 |
204.45 (1.86%) |
206.10 |
201.05 - 207.00 |
0.3378 times |
Thu 23 October 2025 |
200.72 (-2.07%) |
202.25 |
199.50 - 208.80 |
3.2386 times |
Tue 21 October 2025 |
204.96 (0.2%) |
204.57 |
203.54 - 209.49 |
0.2268 times |
Mon 20 October 2025 |
204.56 (1.46%) |
201.05 |
201.05 - 206.61 |
0.6651 times |
Fri 17 October 2025 |
201.62 (-2.31%) |
204.16 |
200.75 - 208.00 |
0.7577 times |
Thu 16 October 2025 |
206.39 (1.65%) |
207.50 |
204.00 - 207.50 |
0.8618 times |
Wed 15 October 2025 |
203.03 (0.1%) |
202.83 |
200.35 - 206.94 |
1.2919 times |
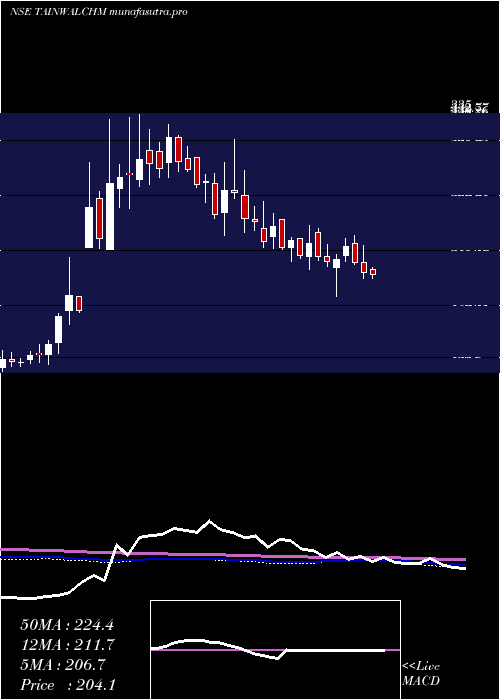
Weekly price and charts TainwalaChemical Strong weekly Stock price targets for TainwalaChemical TAINWALCHM are 197.17 and 204.82 | Weekly Target 1 | 195.56 | | Weekly Target 2 | 198.78 | | Weekly Target 3 | 203.21333333333 | | Weekly Target 4 | 206.43 | | Weekly Target 5 | 210.86 |
Weekly price and volumes for Tainwala Chemical
| Date |
Closing |
Open |
Range |
Volume |
Thu 30 October 2025 |
201.99 (-1.2%) |
207.65 |
200.00 - 207.65 |
0.4612 times |
Fri 24 October 2025 |
204.45 (1.4%) |
201.05 |
199.50 - 209.49 |
0.5267 times |
Fri 17 October 2025 |
201.62 (-2.74%) |
207.29 |
200.35 - 209.15 |
0.4644 times |
Fri 10 October 2025 |
207.29 (-2.37%) |
212.33 |
200.20 - 215.90 |
0.6752 times |
Fri 03 October 2025 |
212.33 (0.81%) |
210.63 |
205.25 - 218.37 |
0.4799 times |
Fri 26 September 2025 |
210.63 (-1.25%) |
216.00 |
209.00 - 220.70 |
1.4001 times |
Fri 19 September 2025 |
213.29 (0.78%) |
213.69 |
210.35 - 219.00 |
0.9552 times |
Fri 12 September 2025 |
211.64 (1.42%) |
207.66 |
207.66 - 218.97 |
0.67 times |
Fri 05 September 2025 |
208.68 (-3.25%) |
215.99 |
206.45 - 216.27 |
2.3098 times |
Fri 29 August 2025 |
215.70 (-3.14%) |
223.10 |
210.60 - 229.41 |
2.0574 times |
Fri 22 August 2025 |
222.70 (0.1%) |
223.58 |
220.05 - 239.40 |
2.2669 times |
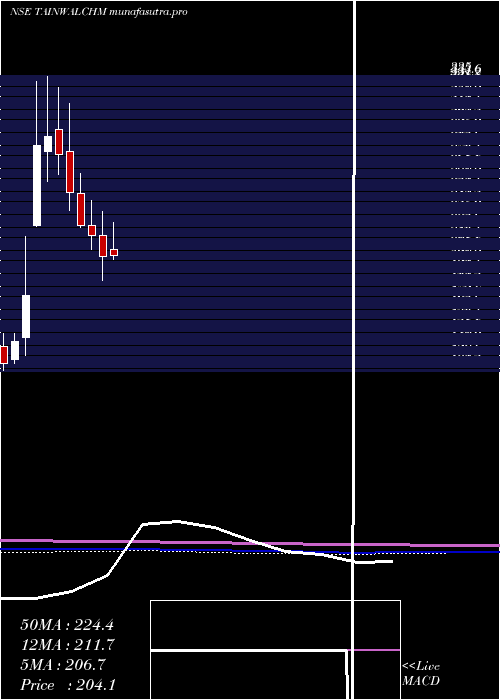
Monthly price and charts TainwalaChemical Strong monthly Stock price targets for TainwalaChemical TAINWALCHM are 191.31 and 210.18 | Monthly Target 1 | 187.75 | | Monthly Target 2 | 194.87 | | Monthly Target 3 | 206.62 | | Monthly Target 4 | 213.74 | | Monthly Target 5 | 225.49 |
Monthly price and volumes Tainwala Chemical
| Date |
Closing |
Open |
Range |
Volume |
Thu 30 October 2025 |
201.99 (-3.19%) |
214.34 |
199.50 - 218.37 |
0.1314 times |
Tue 30 September 2025 |
208.65 (-3.27%) |
215.99 |
205.25 - 220.70 |
0.3118 times |
Fri 29 August 2025 |
215.70 (-7.74%) |
235.00 |
210.60 - 270.00 |
2.9743 times |
Thu 31 July 2025 |
233.79 (3.88%) |
225.66 |
205.00 - 274.99 |
2.9035 times |
Mon 30 June 2025 |
225.06 (8.4%) |
208.00 |
206.74 - 239.70 |
0.324 times |
Fri 30 May 2025 |
207.62 (2%) |
208.19 |
191.50 - 228.00 |
0.2273 times |
Wed 30 April 2025 |
203.54 (-6.94%) |
218.72 |
186.00 - 236.00 |
0.143 times |
Fri 28 March 2025 |
218.71 (-3.23%) |
226.01 |
208.35 - 244.19 |
0.1749 times |
Fri 28 February 2025 |
226.00 (-9.62%) |
249.50 |
224.55 - 263.85 |
0.3701 times |
Fri 31 January 2025 |
250.05 (-10.12%) |
279.85 |
236.60 - 315.00 |
2.4396 times |
Tue 31 December 2024 |
278.20 (-4.51%) |
296.00 |
263.60 - 327.00 |
0.7845 times |
DMA SMA EMA moving averages of Tainwala Chemical TAINWALCHM
DMA (daily moving average) of Tainwala Chemical TAINWALCHM
| DMA period | DMA value | | 5 day DMA | 202.07 | | 12 day DMA | 202.87 | | 20 day DMA | 204.66 | | 35 day DMA | 208.43 | | 50 day DMA | 211.09 | | 100 day DMA | 218 | | 150 day DMA | 216.26 | | 200 day DMA | 222.67 | EMA (exponential moving average) of Tainwala Chemical TAINWALCHM
| EMA period | EMA current | EMA prev | EMA prev2 | | 5 day EMA | 201.9 | 201.85 | 202.41 | | 12 day EMA | 203.13 | 203.34 | 203.81 | | 20 day EMA | 204.84 | 205.14 | 205.6 | | 35 day EMA | 207.93 | 208.28 | 208.72 | | 50 day EMA | 211.23 | 211.61 | 212.05 |
SMA (simple moving average) of Tainwala Chemical TAINWALCHM
| SMA period | SMA current | SMA prev | SMA prev2 | | 5 day SMA | 202.07 | 201.82 | 202.66 | | 12 day SMA | 202.87 | 203.03 | 203.58 | | 20 day SMA | 204.66 | 205 | 205.41 | | 35 day SMA | 208.43 | 208.68 | 208.98 | | 50 day SMA | 211.09 | 211.54 | 211.98 | | 100 day SMA | 218 | 218.17 | 218.29 | | 150 day SMA | 216.26 | 216.44 | 216.61 | | 200 day SMA | 222.67 | 223 | 223.39 |
|
|
