TacInfosec TAC_SM full analysis,charts,indicators,moving averages,SMA,DMA,EMA,ADX,MACD,RSITac Infosec TAC_SM WideScreen charts, DMA,SMA,EMA technical analysis, forecast prediction, by indicators ADX,MACD,RSI,CCI NSE stock exchange
Daily price and charts and targets TacInfosec Strong Daily Stock price targets for TacInfosec TAC_SM are 780.93 and 853.38 | Daily Target 1 | 726.48 | | Daily Target 2 | 762.92 | | Daily Target 3 | 798.93333333333 | | Daily Target 4 | 835.37 | | Daily Target 5 | 871.38 |
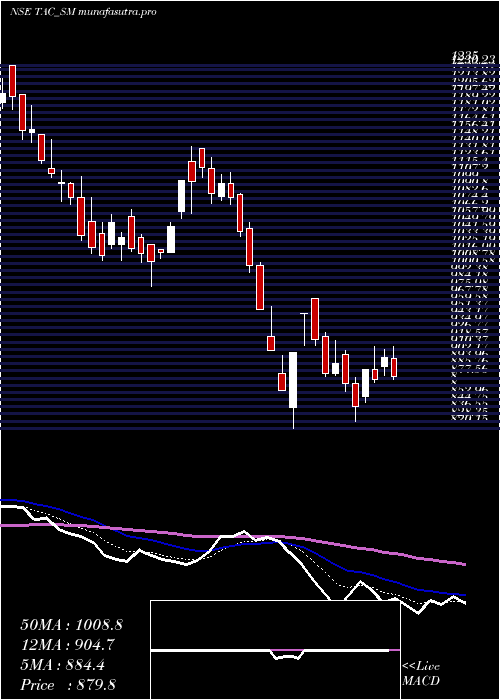
Daily price and volume Tac Infosec
| Date |
Closing |
Open |
Range |
Volume |
Tue 09 December 2025 |
799.35 (4.88%) |
767.00 |
762.50 - 834.95 |
1.9672 times |
Mon 08 December 2025 |
762.15 (5.69%) |
720.00 |
676.00 - 771.00 |
2.8891 times |
Fri 05 December 2025 |
721.15 (-2.64%) |
736.00 |
715.00 - 750.00 |
0.5786 times |
Thu 04 December 2025 |
740.70 (0.82%) |
721.00 |
700.25 - 749.80 |
0.7951 times |
Wed 03 December 2025 |
734.70 (-5%) |
763.85 |
734.70 - 776.00 |
0.9854 times |
Tue 02 December 2025 |
773.35 (-32.52%) |
784.00 |
770.50 - 794.90 |
0.377 times |
Mon 08 September 2025 |
1146.00 (5%) |
1146.00 |
1125.00 - 1146.00 |
1.0433 times |
Fri 05 September 2025 |
1091.45 (1.31%) |
1083.05 |
1052.05 - 1101.45 |
0.293 times |
Thu 04 September 2025 |
1077.35 (-1.69%) |
1121.00 |
1068.20 - 1122.00 |
0.4311 times |
Wed 03 September 2025 |
1095.85 (4.78%) |
1027.55 |
1027.55 - 1098.15 |
0.6402 times |
Tue 02 September 2025 |
1045.90 (1.65%) |
1001.00 |
1001.00 - 1055.00 |
0.3285 times |
Weekly price and charts TacInfosec Strong weekly Stock price targets for TacInfosec TAC_SM are 737.68 and 896.63 | Weekly Target 1 | 611.15 | | Weekly Target 2 | 705.25 | | Weekly Target 3 | 770.1 | | Weekly Target 4 | 864.2 | | Weekly Target 5 | 929.05 |
Weekly price and volumes for Tac Infosec
| Date |
Closing |
Open |
Range |
Volume |
Tue 09 December 2025 |
799.35 (10.84%) |
720.00 |
676.00 - 834.95 |
1.2324 times |
Fri 05 December 2025 |
721.15 (-33.93%) |
1146.00 |
700.25 - 1146.00 |
0.9591 times |
Fri 05 September 2025 |
1091.45 (1.79%) |
1085.00 |
1001.00 - 1122.00 |
0.5404 times |
Fri 29 August 2025 |
1072.25 (-1.33%) |
1109.95 |
1026.05 - 1155.25 |
1.5919 times |
Fri 22 August 2025 |
1086.65 (27.61%) |
865.00 |
864.00 - 1086.65 |
0.2359 times |
Thu 14 August 2025 |
851.55 (-3.64%) |
888.10 |
819.00 - 902.00 |
0.3761 times |
Fri 08 August 2025 |
883.70 (2.71%) |
874.00 |
850.30 - 969.00 |
0.6091 times |
Fri 01 August 2025 |
860.35 (-3%) |
887.00 |
855.00 - 913.95 |
0.4125 times |
Fri 25 July 2025 |
886.95 (-3.78%) |
924.95 |
828.05 - 930.00 |
0.8848 times |
Fri 18 July 2025 |
921.75 (-3.63%) |
925.00 |
820.15 - 969.00 |
3.1578 times |
Fri 11 July 2025 |
956.50 (-12.1%) |
1085.00 |
956.50 - 1113.00 |
1.0576 times |

Monthly price and charts TacInfosec Strong monthly Stock price targets for TacInfosec TAC_SM are 737.68 and 896.63 | Monthly Target 1 | 611.15 | | Monthly Target 2 | 705.25 | | Monthly Target 3 | 770.1 | | Monthly Target 4 | 864.2 | | Monthly Target 5 | 929.05 |
Monthly price and volumes Tac Infosec
| Date |
Closing |
Open |
Range |
Volume |
Tue 09 December 2025 |
799.35 (-30.25%) |
784.00 |
676.00 - 834.95 |
0.7074 times |
Mon 08 September 2025 |
1146.00 (6.88%) |
1085.00 |
1001.00 - 1146.00 |
0.2956 times |
Fri 29 August 2025 |
1072.25 (21.42%) |
874.00 |
819.00 - 1155.25 |
1.0631 times |
Thu 31 July 2025 |
883.10 (-15.98%) |
1068.00 |
820.15 - 1142.70 |
2.2951 times |
Mon 30 June 2025 |
1051.05 (-16.29%) |
1284.00 |
982.00 - 1284.00 |
1.1946 times |
Fri 30 May 2025 |
1255.60 (8.3%) |
1185.00 |
968.90 - 1437.95 |
1.1393 times |
Wed 30 April 2025 |
1159.35 (-12.8%) |
1388.00 |
1008.00 - 1427.90 |
1.1134 times |
Fri 28 March 2025 |
1329.50 (103.75%) |
1349.10 |
1232.05 - 1349.10 |
0.105 times |
Tue 08 October 2024 |
652.50 (-5.1%) |
721.95 |
652.50 - 750.00 |
0.2942 times |
Mon 30 September 2024 |
687.60 (-7.86%) |
755.00 |
636.05 - 900.00 |
1.7924 times |
Fri 30 August 2024 |
746.25 (43.65%) |
518.00 |
500.50 - 895.80 |
3.1487 times |

DMA SMA EMA moving averages of Tac Infosec TAC_SM
DMA (daily moving average) of Tac Infosec TAC_SM
| DMA period | DMA value | | 5 day DMA | 751.61 | | 12 day DMA | 918.07 | | 20 day DMA | 970.11 | | 35 day DMA | 933.44 | | 50 day DMA | 935.89 | | 100 day DMA | 1042.03 | | 150 day DMA | 1005.51 | | 200 day DMA | 893.58 | EMA (exponential moving average) of Tac Infosec TAC_SM
| EMA period | EMA current | EMA prev | EMA prev2 | | 5 day EMA | 794.74 | 792.44 | 807.59 | | 12 day EMA | 870.6 | 883.55 | 905.61 | | 20 day EMA | 908.51 | 919.99 | 936.6 | | 35 day EMA | 937.05 | 945.16 | 955.93 | | 50 day EMA | 930.63 | 935.99 | 943.08 |
SMA (simple moving average) of Tac Infosec TAC_SM
| SMA period | SMA current | SMA prev | SMA prev2 | | 5 day SMA | 751.61 | 746.41 | 823.18 | | 12 day SMA | 918.07 | 940.81 | 970.53 | | 20 day SMA | 970.11 | 974.85 | 979.32 | | 35 day SMA | 933.44 | 935.94 | 938.3 | | 50 day SMA | 935.89 | 941.67 | 948.79 | | 100 day SMA | 1042.03 | 1045.69 | 1050.34 | | 150 day SMA | 1005.51 | 1004.65 | 1004.18 | | 200 day SMA | 893.58 | 891.86 | 890.22 |
|
|
