SystangoTechnologies SYSTANGO_SM full analysis,charts,indicators,moving averages,SMA,DMA,EMA,ADX,MACD,RSISystango Technologies SYSTANGO_SM WideScreen charts, DMA,SMA,EMA technical analysis, forecast prediction, by indicators ADX,MACD,RSI,CCI NSE stock exchange
Daily price and charts and targets SystangoTechnologies Strong Daily Stock price targets for SystangoTechnologies SYSTANGO_SM are 231.48 and 237.98 | Daily Target 1 | 230.32 | | Daily Target 2 | 232.63 | | Daily Target 3 | 236.81666666667 | | Daily Target 4 | 239.13 | | Daily Target 5 | 243.32 |
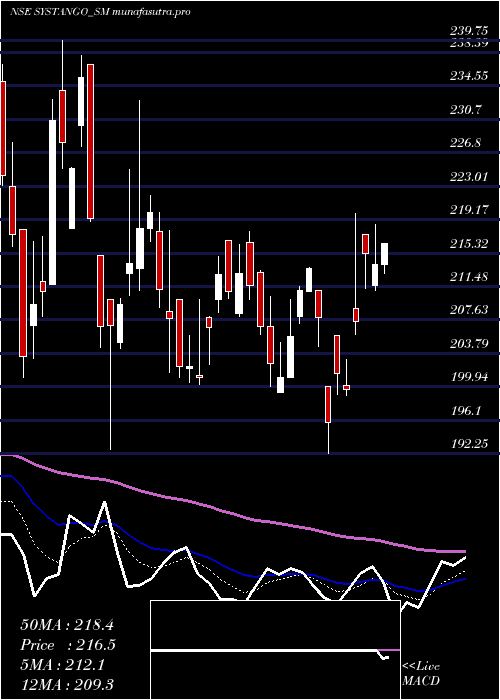
Daily price and volume Systango Technologies
| Date |
Closing |
Open |
Range |
Volume |
Tue 28 October 2025 |
234.95 (-0.23%) |
237.00 |
234.50 - 241.00 |
1.5869 times |
Mon 27 October 2025 |
235.50 (2.21%) |
232.70 |
230.00 - 237.20 |
0.7557 times |
Fri 24 October 2025 |
230.40 (1.61%) |
231.35 |
226.45 - 232.00 |
0.5542 times |
Thu 23 October 2025 |
226.75 (-2.33%) |
228.15 |
226.25 - 232.50 |
0.8564 times |
Tue 21 October 2025 |
232.15 (1.18%) |
237.85 |
228.05 - 237.85 |
0.3778 times |
Mon 20 October 2025 |
229.45 (1.82%) |
229.00 |
226.15 - 230.00 |
0.4786 times |
Fri 17 October 2025 |
225.35 (-3.28%) |
235.00 |
224.20 - 235.00 |
2.4685 times |
Thu 16 October 2025 |
233.00 (-1.23%) |
237.05 |
231.00 - 237.05 |
0.8816 times |
Wed 15 October 2025 |
235.90 (1.75%) |
234.00 |
233.20 - 239.00 |
1.3098 times |
Tue 14 October 2025 |
231.85 (-0.71%) |
232.10 |
227.50 - 234.45 |
0.7305 times |
Mon 13 October 2025 |
233.50 (-0.64%) |
230.00 |
230.00 - 237.85 |
0.6549 times |
Weekly price and charts SystangoTechnologies Strong weekly Stock price targets for SystangoTechnologies SYSTANGO_SM are 232.48 and 243.48 | Weekly Target 1 | 224.32 | | Weekly Target 2 | 229.63 | | Weekly Target 3 | 235.31666666667 | | Weekly Target 4 | 240.63 | | Weekly Target 5 | 246.32 |
Weekly price and volumes for Systango Technologies
| Date |
Closing |
Open |
Range |
Volume |
Tue 28 October 2025 |
234.95 (1.97%) |
232.70 |
230.00 - 241.00 |
0.6813 times |
Fri 24 October 2025 |
230.40 (2.24%) |
229.00 |
226.15 - 237.85 |
0.6593 times |
Fri 17 October 2025 |
225.35 (-4.11%) |
230.00 |
224.20 - 239.00 |
1.7582 times |
Fri 10 October 2025 |
235.00 (1.51%) |
227.15 |
226.00 - 238.00 |
1.3333 times |
Fri 03 October 2025 |
231.50 (3.46%) |
224.50 |
221.00 - 232.00 |
0.5861 times |
Fri 26 September 2025 |
223.75 (-3.97%) |
226.20 |
222.00 - 236.85 |
0.8132 times |
Fri 19 September 2025 |
233.00 (0.22%) |
231.35 |
231.35 - 243.00 |
0.9597 times |
Fri 12 September 2025 |
232.50 (2.29%) |
230.15 |
224.60 - 240.80 |
1.5018 times |
Fri 05 September 2025 |
227.30 (-1.84%) |
238.00 |
225.00 - 239.00 |
0.9231 times |
Fri 29 August 2025 |
231.55 (-3.32%) |
241.80 |
229.00 - 243.40 |
0.7839 times |
Fri 22 August 2025 |
239.50 (8.4%) |
225.00 |
224.00 - 253.70 |
2.315 times |

Monthly price and charts SystangoTechnologies Strong monthly Stock price targets for SystangoTechnologies SYSTANGO_SM are 228.23 and 247.73 | Monthly Target 1 | 212.98 | | Monthly Target 2 | 223.97 | | Monthly Target 3 | 232.48333333333 | | Monthly Target 4 | 243.47 | | Monthly Target 5 | 251.98 |
Monthly price and volumes Systango Technologies
| Date |
Closing |
Open |
Range |
Volume |
Tue 28 October 2025 |
234.95 (5.6%) |
222.50 |
221.50 - 241.00 |
0.513 times |
Tue 30 September 2025 |
222.50 (-3.91%) |
238.00 |
221.00 - 243.00 |
0.4753 times |
Fri 29 August 2025 |
231.55 (-0.32%) |
233.00 |
214.60 - 253.70 |
0.5797 times |
Thu 31 July 2025 |
232.30 (-6.71%) |
246.75 |
231.00 - 253.00 |
0.6009 times |
Mon 30 June 2025 |
249.00 (-1.56%) |
259.40 |
240.00 - 266.00 |
0.7698 times |
Fri 30 May 2025 |
252.95 (16.49%) |
218.00 |
203.00 - 284.00 |
1.3723 times |
Wed 30 April 2025 |
217.15 (8.03%) |
201.00 |
192.25 - 227.30 |
0.436 times |
Fri 28 March 2025 |
201.00 (-2.85%) |
210.00 |
192.70 - 232.85 |
1.2019 times |
Fri 28 February 2025 |
206.90 (-17.01%) |
252.00 |
201.00 - 265.50 |
0.7274 times |
Fri 31 January 2025 |
249.30 (-0.04%) |
247.20 |
227.30 - 301.30 |
3.3236 times |
Tue 31 December 2024 |
249.40 (-7.53%) |
270.00 |
236.60 - 281.00 |
2.7298 times |

DMA SMA EMA moving averages of Systango Technologies SYSTANGO_SM
DMA (daily moving average) of Systango Technologies SYSTANGO_SM
| DMA period | DMA value | | 5 day DMA | 231.95 | | 12 day DMA | 231.98 | | 20 day DMA | 230.67 | | 35 day DMA | 231.35 | | 50 day DMA | 232.44 | | 100 day DMA | 236.5 | | 150 day DMA | 230.86 | | 200 day DMA | 233.15 | EMA (exponential moving average) of Systango Technologies SYSTANGO_SM
| EMA period | EMA current | EMA prev | EMA prev2 | | 5 day EMA | 232.79 | 231.71 | 229.82 | | 12 day EMA | 231.76 | 231.18 | 230.39 | | 20 day EMA | 231.42 | 231.05 | 230.58 | | 35 day EMA | 231.41 | 231.2 | 230.95 | | 50 day EMA | 231.55 | 231.41 | 231.24 |
SMA (simple moving average) of Systango Technologies SYSTANGO_SM
| SMA period | SMA current | SMA prev | SMA prev2 | | 5 day SMA | 231.95 | 230.85 | 228.82 | | 12 day SMA | 231.98 | 231.96 | 231.47 | | 20 day SMA | 230.67 | 230.11 | 229.62 | | 35 day SMA | 231.35 | 231.14 | 231.04 | | 50 day SMA | 232.44 | 232.24 | 231.98 | | 100 day SMA | 236.5 | 236.63 | 236.78 | | 150 day SMA | 230.86 | 230.63 | 230.41 | | 200 day SMA | 233.15 | 233.23 | 233.28 |
|
|
