SuntechInfra SUNTECH_SM full analysis,charts,indicators,moving averages,SMA,DMA,EMA,ADX,MACD,RSISuntech Infra SUNTECH_SM WideScreen charts, DMA,SMA,EMA technical analysis, forecast prediction, by indicators ADX,MACD,RSI,CCI NSE stock exchange
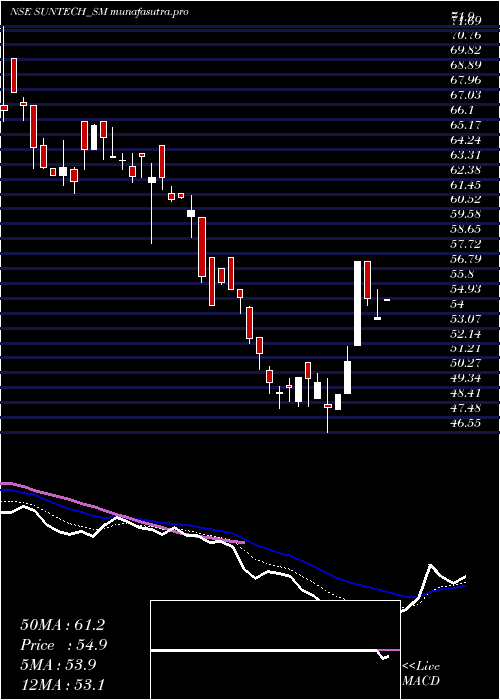
Daily price and charts and targets SuntechInfra Strong Daily Stock price targets for SuntechInfra SUNTECH_SM are 54.83 and 54.88 | Daily Target 1 | 54.78 | | Daily Target 2 | 54.82 | | Daily Target 3 | 54.833333333333 | | Daily Target 4 | 54.87 | | Daily Target 5 | 54.88 |
Daily price and volume Suntech Infra
| Date |
Closing |
Open |
Range |
Volume |
Tue 28 October 2025 |
54.85 (2.05%) |
54.80 |
54.80 - 54.85 |
0.117 times |
Mon 27 October 2025 |
53.75 (-2.18%) |
53.60 |
53.60 - 55.45 |
0.7602 times |
Fri 24 October 2025 |
54.95 (-3.93%) |
57.25 |
54.50 - 57.25 |
0.6433 times |
Thu 23 October 2025 |
57.20 (12.16%) |
52.00 |
52.00 - 57.20 |
1.8713 times |
Mon 20 October 2025 |
51.00 (4.19%) |
49.00 |
49.00 - 51.90 |
0.8187 times |
Fri 17 October 2025 |
48.95 (1.77%) |
48.00 |
48.00 - 48.95 |
0.2339 times |
Thu 16 October 2025 |
48.10 (-3.12%) |
48.30 |
46.55 - 49.90 |
3.6257 times |
Wed 15 October 2025 |
49.65 (-0.6%) |
48.65 |
48.65 - 50.25 |
0.4094 times |
Tue 14 October 2025 |
49.95 (-0.1%) |
50.90 |
48.20 - 50.90 |
1.0526 times |
Mon 13 October 2025 |
50.00 (1.32%) |
48.50 |
48.20 - 50.00 |
0.4678 times |
Fri 10 October 2025 |
49.35 (0.61%) |
49.50 |
48.50 - 49.90 |
0.4094 times |
Weekly price and charts SuntechInfra Strong weekly Stock price targets for SuntechInfra SUNTECH_SM are 54.23 and 56.08 | Weekly Target 1 | 52.78 | | Weekly Target 2 | 53.82 | | Weekly Target 3 | 54.633333333333 | | Weekly Target 4 | 55.67 | | Weekly Target 5 | 56.48 |
Weekly price and volumes for Suntech Infra
| Date |
Closing |
Open |
Range |
Volume |
Tue 28 October 2025 |
54.85 (-0.18%) |
53.60 |
53.60 - 55.45 |
0.179 times |
Fri 24 October 2025 |
54.95 (12.26%) |
49.00 |
49.00 - 57.25 |
0.6802 times |
Fri 17 October 2025 |
48.95 (-0.81%) |
48.50 |
46.55 - 50.90 |
1.1814 times |
Fri 10 October 2025 |
49.35 (-10.27%) |
54.35 |
48.05 - 54.40 |
0.9308 times |
Fri 03 October 2025 |
55.00 (-2.31%) |
57.50 |
54.00 - 57.50 |
0.3461 times |
Fri 26 September 2025 |
56.30 (-9.92%) |
64.50 |
55.90 - 64.50 |
1.3962 times |
Fri 19 September 2025 |
62.50 (-3.85%) |
63.75 |
58.35 - 65.60 |
1.611 times |
Fri 12 September 2025 |
65.00 (3.83%) |
62.60 |
61.50 - 66.00 |
1.2172 times |
Fri 05 September 2025 |
62.60 (-6.08%) |
69.90 |
62.60 - 69.90 |
0.9427 times |
Fri 29 August 2025 |
66.65 (-4.92%) |
70.30 |
64.00 - 73.00 |
1.5155 times |
Fri 22 August 2025 |
70.10 (0.14%) |
70.00 |
70.00 - 73.85 |
0.4773 times |
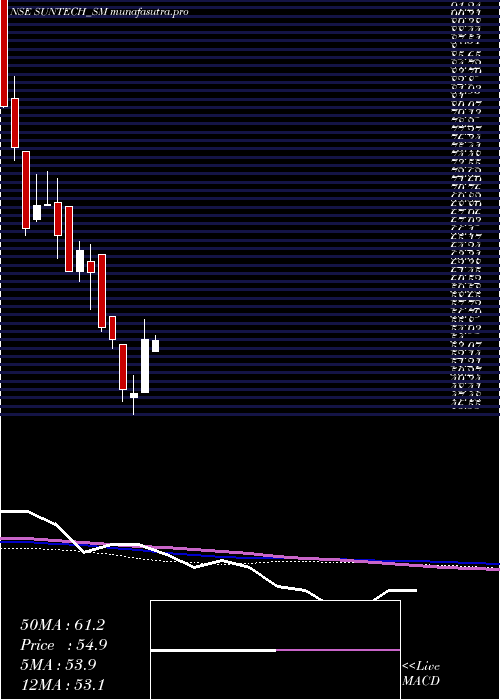
Monthly price and charts SuntechInfra Strong monthly Stock price targets for SuntechInfra SUNTECH_SM are 45.23 and 56.18 | Monthly Target 1 | 42.02 | | Monthly Target 2 | 48.43 | | Monthly Target 3 | 52.966666666667 | | Monthly Target 4 | 59.38 | | Monthly Target 5 | 63.92 |
Monthly price and volumes Suntech Infra
| Date |
Closing |
Open |
Range |
Volume |
Tue 28 October 2025 |
54.85 (-1.88%) |
57.50 |
46.55 - 57.50 |
0.4011 times |
Tue 30 September 2025 |
55.90 (-16.13%) |
69.90 |
54.50 - 69.90 |
0.6915 times |
Fri 29 August 2025 |
66.65 (-15.74%) |
78.25 |
64.00 - 78.25 |
0.7576 times |
Thu 31 July 2025 |
79.10 (0%) |
88.85 |
75.05 - 103.40 |
2.1498 times |
Tue 28 October 2025 |
(0%) |
|
- |
0 times |

DMA SMA EMA moving averages of Suntech Infra SUNTECH_SM
DMA (daily moving average) of Suntech Infra SUNTECH_SM
| DMA period | DMA value | | 5 day DMA | 54.35 | | 12 day DMA | 51.4 | | 20 day DMA | 52.38 | | 35 day DMA | 56.91 | | 50 day DMA | 60.57 | | 100 day DMA | | | 150 day DMA | | | 200 day DMA | | EMA (exponential moving average) of Suntech Infra SUNTECH_SM
| EMA period | EMA current | EMA prev | EMA prev2 | | 5 day EMA | 53.86 | 53.37 | 53.18 | | 12 day EMA | 53.04 | 52.71 | 52.52 | | 20 day EMA | 53.97 | 53.88 | 53.89 | | 35 day EMA | 56.88 | 57 | 57.19 | | 50 day EMA | 60.74 | 60.98 | 61.28 |
SMA (simple moving average) of Suntech Infra SUNTECH_SM
| SMA period | SMA current | SMA prev | SMA prev2 | | 5 day SMA | 54.35 | 53.17 | 52.04 | | 12 day SMA | 51.4 | 50.97 | 50.78 | | 20 day SMA | 52.38 | 52.66 | 53.04 | | 35 day SMA | 56.91 | 57.15 | 57.45 | | 50 day SMA | 60.57 | 60.94 | 61.25 | | 100 day SMA | | 150 day SMA | | 200 day SMA |
|
|
