SundaramFinance SUNDARMFIN full analysis,charts,indicators,moving averages,SMA,DMA,EMA,ADX,MACD,RSISundaram Finance SUNDARMFIN WideScreen charts, DMA,SMA,EMA technical analysis, forecast prediction, by indicators ADX,MACD,RSI,CCI NSE stock exchange
Daily price and charts and targets SundaramFinance Strong Daily Stock price targets for SundaramFinance SUNDARMFIN are 4676.15 and 4745.35 | Daily Target 1 | 4626.3 | | Daily Target 2 | 4656.8 | | Daily Target 3 | 4695.5 | | Daily Target 4 | 4726 | | Daily Target 5 | 4764.7 |
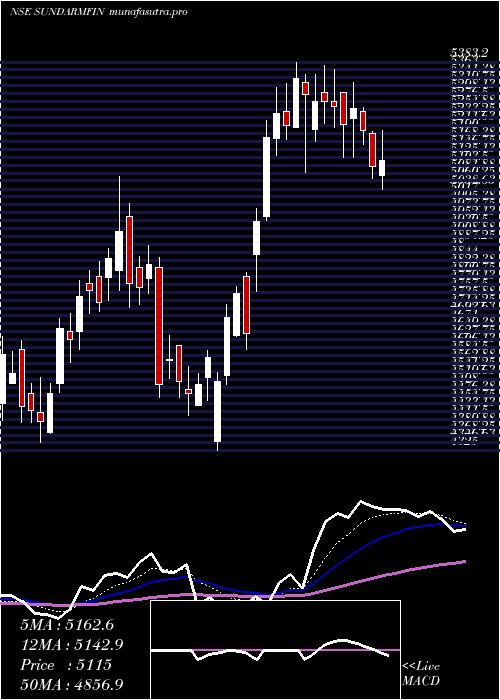
Daily price and volume Sundaram Finance
| Date |
Closing |
Open |
Range |
Volume |
Tue 28 October 2025 |
4687.30 (0.07%) |
4669.50 |
4665.00 - 4734.20 |
1.2711 times |
Mon 27 October 2025 |
4684.20 (0.8%) |
4631.00 |
4612.50 - 4709.00 |
1.2445 times |
Fri 24 October 2025 |
4647.00 (0.82%) |
4610.00 |
4600.50 - 4669.90 |
1.3086 times |
Thu 23 October 2025 |
4609.40 (1.38%) |
4547.00 |
4520.00 - 4638.00 |
1.097 times |
Tue 21 October 2025 |
4546.70 (0.56%) |
4560.00 |
4513.00 - 4566.50 |
0.1547 times |
Mon 20 October 2025 |
4521.60 (0.74%) |
4470.00 |
4425.00 - 4551.50 |
1.0899 times |
Fri 17 October 2025 |
4488.20 (-0.05%) |
4492.50 |
4452.50 - 4510.00 |
0.6866 times |
Thu 16 October 2025 |
4490.60 (-0.58%) |
4548.00 |
4460.30 - 4548.00 |
0.8913 times |
Wed 15 October 2025 |
4516.90 (2.06%) |
4450.00 |
4430.00 - 4550.00 |
1.1947 times |
Tue 14 October 2025 |
4425.90 (-0.09%) |
4429.80 |
4382.40 - 4525.40 |
1.0616 times |
Mon 13 October 2025 |
4429.80 (0.46%) |
4395.00 |
4376.70 - 4460.00 |
0.877 times |
Weekly price and charts SundaramFinance Strong weekly Stock price targets for SundaramFinance SUNDARMFIN are 4649.9 and 4771.6 | Weekly Target 1 | 4556.3 | | Weekly Target 2 | 4621.8 | | Weekly Target 3 | 4678 | | Weekly Target 4 | 4743.5 | | Weekly Target 5 | 4799.7 |
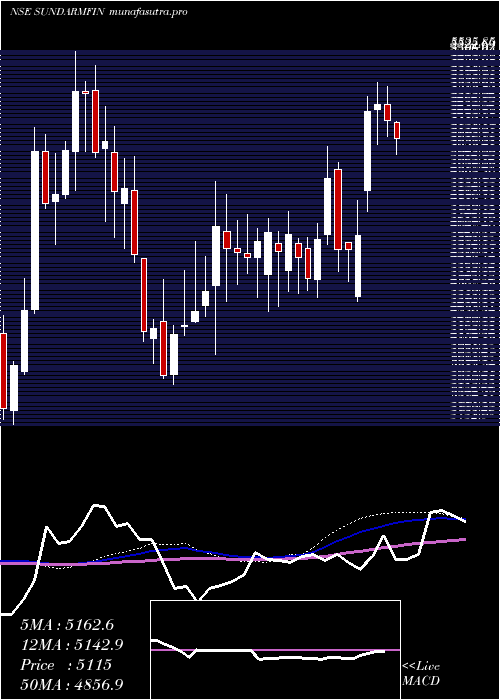
Weekly price and volumes for Sundaram Finance
| Date |
Closing |
Open |
Range |
Volume |
Tue 28 October 2025 |
4687.30 (0.87%) |
4631.00 |
4612.50 - 4734.20 |
0.2798 times |
Fri 24 October 2025 |
4647.00 (3.54%) |
4470.00 |
4425.00 - 4669.90 |
0.4059 times |
Fri 17 October 2025 |
4488.20 (1.78%) |
4395.00 |
4376.70 - 4550.00 |
0.524 times |
Fri 10 October 2025 |
4409.50 (-0.07%) |
4426.00 |
4330.10 - 4503.10 |
0.4336 times |
Fri 03 October 2025 |
4412.40 (-1.63%) |
4485.00 |
4200.00 - 4499.00 |
1.264 times |
Fri 26 September 2025 |
4485.50 (-2%) |
4576.90 |
4469.80 - 4738.50 |
0.5727 times |
Fri 19 September 2025 |
4576.90 (2.34%) |
4475.00 |
4352.00 - 4668.70 |
1.2475 times |
Fri 12 September 2025 |
4472.30 (-1.44%) |
4538.00 |
4451.80 - 4645.00 |
0.6698 times |
Fri 05 September 2025 |
4537.50 (0.97%) |
4509.20 |
4246.50 - 4552.00 |
1.3406 times |
Fri 29 August 2025 |
4493.70 (-14.7%) |
5268.40 |
4475.00 - 5268.40 |
3.2621 times |
Fri 22 August 2025 |
5268.40 (16.18%) |
4645.00 |
4529.90 - 5300.00 |
1.6082 times |
Monthly price and charts SundaramFinance Strong monthly Stock price targets for SundaramFinance SUNDARMFIN are 4494.15 and 4927.35 | Monthly Target 1 | 4140.97 | | Monthly Target 2 | 4414.13 | | Monthly Target 3 | 4574.1666666667 | | Monthly Target 4 | 4847.33 | | Monthly Target 5 | 5007.37 |
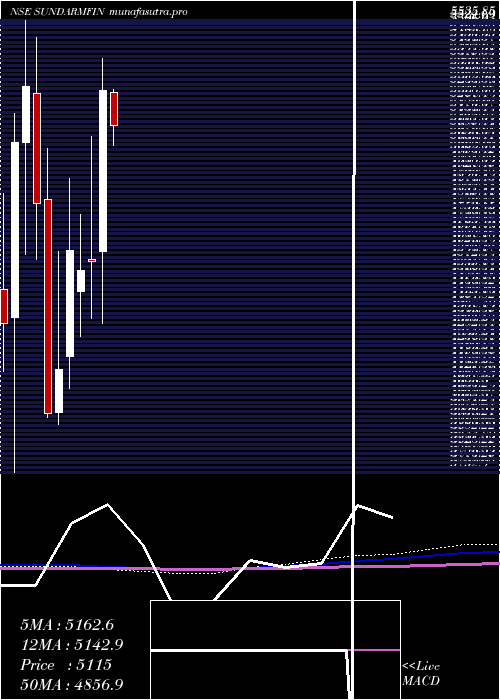
Monthly price and volumes Sundaram Finance
| Date |
Closing |
Open |
Range |
Volume |
Tue 28 October 2025 |
4687.30 (6.25%) |
4301.00 |
4301.00 - 4734.20 |
0.3236 times |
Tue 30 September 2025 |
4411.50 (-1.83%) |
4509.20 |
4200.00 - 4738.50 |
0.7683 times |
Fri 29 August 2025 |
4493.70 (-3.88%) |
4710.00 |
4431.50 - 5300.00 |
1.0319 times |
Thu 31 July 2025 |
4675.00 (-9.64%) |
5193.00 |
4597.50 - 5240.00 |
0.5468 times |
Mon 30 June 2025 |
5173.50 (0.72%) |
5126.00 |
4702.00 - 5199.50 |
0.8271 times |
Fri 30 May 2025 |
5136.50 (-2.28%) |
5250.00 |
4792.50 - 5419.00 |
0.7214 times |
Wed 30 April 2025 |
5256.60 (14.91%) |
4612.00 |
4325.00 - 5383.20 |
0.7125 times |
Fri 28 March 2025 |
4574.45 (0.81%) |
4582.00 |
4347.00 - 5072.90 |
0.8662 times |
Fri 28 February 2025 |
4537.75 (-1.72%) |
4454.10 |
4275.65 - 4760.00 |
0.9241 times |
Fri 31 January 2025 |
4617.00 (11.42%) |
4193.70 |
4066.80 - 4905.15 |
3.278 times |
Tue 31 December 2024 |
4143.70 (4.42%) |
3969.95 |
3925.05 - 4614.65 |
1.2687 times |
DMA SMA EMA moving averages of Sundaram Finance SUNDARMFIN
DMA (daily moving average) of Sundaram Finance SUNDARMFIN
| DMA period | DMA value | | 5 day DMA | 4634.92 | | 12 day DMA | 4538.09 | | 20 day DMA | 4480.83 | | 35 day DMA | 4514.07 | | 50 day DMA | 4581.83 | | 100 day DMA | 4755.02 | | 150 day DMA | 4838.85 | | 200 day DMA | 4765.99 | EMA (exponential moving average) of Sundaram Finance SUNDARMFIN
| EMA period | EMA current | EMA prev | EMA prev2 | | 5 day EMA | 4637.56 | 4612.7 | 4576.96 | | 12 day EMA | 4569.95 | 4548.62 | 4523.98 | | 20 day EMA | 4544.88 | 4529.9 | 4513.66 | | 35 day EMA | 4551.05 | 4543.03 | 4534.72 | | 50 day EMA | 4583.24 | 4578.99 | 4574.7 |
SMA (simple moving average) of Sundaram Finance SUNDARMFIN
| SMA period | SMA current | SMA prev | SMA prev2 | | 5 day SMA | 4634.92 | 4601.78 | 4562.58 | | 12 day SMA | 4538.09 | 4513.98 | 4488.09 | | 20 day SMA | 4480.83 | 4470.74 | 4466.01 | | 35 day SMA | 4514.07 | 4509.79 | 4504.4 | | 50 day SMA | 4581.83 | 4577.6 | 4573.92 | | 100 day SMA | 4755.02 | 4758.79 | 4761.91 | | 150 day SMA | 4838.85 | 4839.13 | 4839.65 | | 200 day SMA | 4765.99 | 4764.83 | 4764.85 |
|
|
