SulaVineyards SULA full analysis,charts,indicators,moving averages,SMA,DMA,EMA,ADX,MACD,RSISula Vineyards SULA WideScreen charts, DMA,SMA,EMA technical analysis, forecast prediction, by indicators ADX,MACD,RSI,CCI NSE stock exchange
Daily price and charts and targets SulaVineyards Strong Daily Stock price targets for SulaVineyards SULA are 244.35 and 248.6 | Daily Target 1 | 243.45 | | Daily Target 2 | 245.25 | | Daily Target 3 | 247.7 | | Daily Target 4 | 249.5 | | Daily Target 5 | 251.95 |
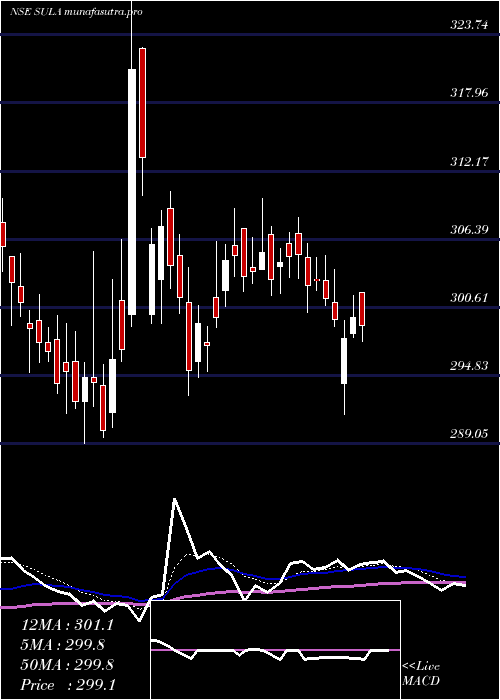
Daily price and volume Sula Vineyards
| Date |
Closing |
Open |
Range |
Volume |
Wed 29 October 2025 |
247.05 (-0.38%) |
248.60 |
245.90 - 250.15 |
1.3901 times |
Tue 28 October 2025 |
248.00 (-1.1%) |
250.00 |
247.50 - 250.45 |
0.8817 times |
Mon 27 October 2025 |
250.75 (-1.3%) |
254.55 |
250.05 - 255.00 |
0.5954 times |
Fri 24 October 2025 |
254.05 (-0.66%) |
255.00 |
252.05 - 255.05 |
0.5073 times |
Thu 23 October 2025 |
255.75 (0.67%) |
256.00 |
254.05 - 259.35 |
1.5747 times |
Tue 21 October 2025 |
254.05 (1.22%) |
251.80 |
251.80 - 254.85 |
0.3398 times |
Mon 20 October 2025 |
251.00 (0.8%) |
251.05 |
248.00 - 251.40 |
0.662 times |
Fri 17 October 2025 |
249.00 (0%) |
249.00 |
248.50 - 257.00 |
1.8394 times |
Thu 16 October 2025 |
249.00 (0.26%) |
248.50 |
246.95 - 251.20 |
1.1461 times |
Wed 15 October 2025 |
248.35 (-0.64%) |
249.95 |
247.70 - 250.60 |
1.0635 times |
Tue 14 October 2025 |
249.95 (-1.54%) |
254.30 |
247.60 - 255.45 |
1.3013 times |
Weekly price and charts SulaVineyards Strong weekly Stock price targets for SulaVineyards SULA are 241.93 and 251.03 | Weekly Target 1 | 240.22 | | Weekly Target 2 | 243.63 | | Weekly Target 3 | 249.31666666667 | | Weekly Target 4 | 252.73 | | Weekly Target 5 | 258.42 |
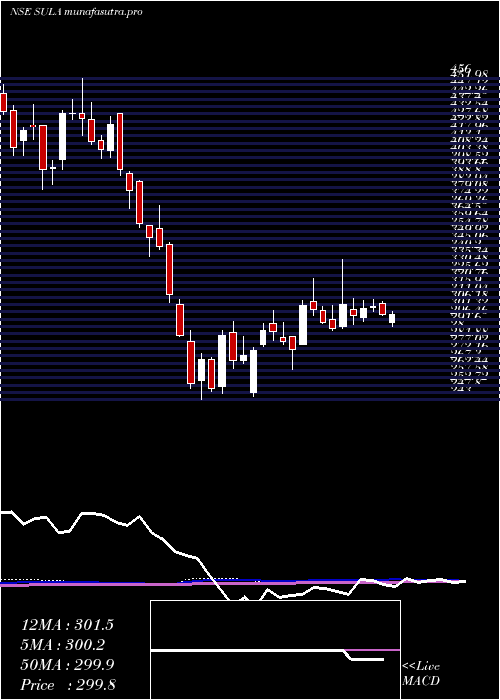
Weekly price and volumes for Sula Vineyards
| Date |
Closing |
Open |
Range |
Volume |
Wed 29 October 2025 |
247.05 (-2.76%) |
254.55 |
245.90 - 255.00 |
0.268 times |
Fri 24 October 2025 |
254.05 (2.03%) |
251.05 |
248.00 - 259.35 |
0.2882 times |
Fri 17 October 2025 |
249.00 (-3.47%) |
257.50 |
246.95 - 258.60 |
0.5821 times |
Fri 10 October 2025 |
257.95 (-2.24%) |
263.85 |
257.25 - 266.65 |
0.3679 times |
Fri 03 October 2025 |
263.85 (-0.31%) |
267.79 |
255.51 - 267.79 |
0.3804 times |
Fri 26 September 2025 |
264.67 (-7.07%) |
285.60 |
263.01 - 292.74 |
0.5488 times |
Fri 19 September 2025 |
284.80 (-0.55%) |
284.55 |
280.00 - 290.00 |
0.6444 times |
Fri 12 September 2025 |
286.37 (13.91%) |
252.79 |
251.41 - 296.80 |
5.8629 times |
Fri 05 September 2025 |
251.40 (0.78%) |
249.70 |
247.00 - 257.00 |
0.4775 times |
Fri 29 August 2025 |
249.45 (-6.68%) |
268.80 |
245.90 - 270.30 |
0.5797 times |
Fri 22 August 2025 |
267.30 (7.24%) |
250.05 |
247.80 - 274.00 |
3.2308 times |
Monthly price and charts SulaVineyards Strong monthly Stock price targets for SulaVineyards SULA are 236.1 and 256.85 | Monthly Target 1 | 232.45 | | Monthly Target 2 | 239.75 | | Monthly Target 3 | 253.2 | | Monthly Target 4 | 260.5 | | Monthly Target 5 | 273.95 |
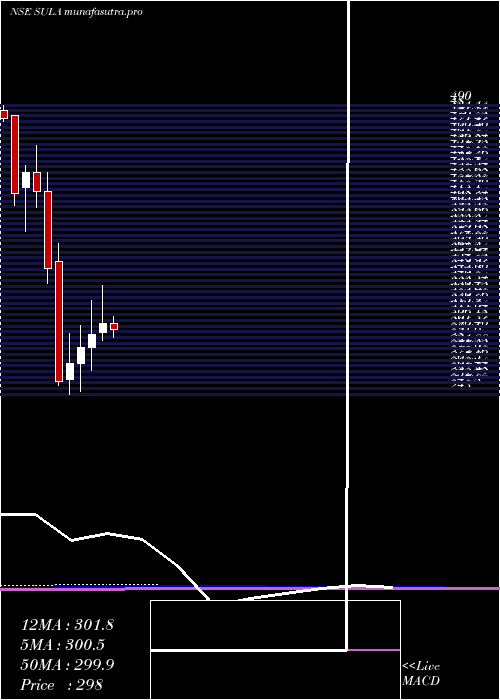
Monthly price and volumes Sula Vineyards
| Date |
Closing |
Open |
Range |
Volume |
Wed 29 October 2025 |
247.05 (-5.12%) |
260.45 |
245.90 - 266.65 |
0.5425 times |
Tue 30 September 2025 |
260.38 (4.38%) |
249.70 |
247.00 - 296.80 |
2.5945 times |
Fri 29 August 2025 |
249.45 (-13.04%) |
287.00 |
245.90 - 291.00 |
1.5081 times |
Thu 31 July 2025 |
286.85 (-5.52%) |
303.80 |
286.25 - 309.80 |
0.3627 times |
Mon 30 June 2025 |
303.60 (3.23%) |
295.95 |
289.05 - 335.90 |
1.536 times |
Fri 30 May 2025 |
294.10 (3.79%) |
283.35 |
263.10 - 323.20 |
0.5444 times |
Wed 30 April 2025 |
283.35 (5.2%) |
269.35 |
245.50 - 302.00 |
0.555 times |
Fri 28 March 2025 |
269.35 (6.13%) |
256.00 |
243.00 - 294.90 |
1.0426 times |
Fri 28 February 2025 |
253.80 (-27.61%) |
356.80 |
250.25 - 371.95 |
0.8733 times |
Fri 31 January 2025 |
350.60 (-15.87%) |
416.75 |
338.05 - 432.80 |
0.441 times |
Tue 31 December 2024 |
416.75 (-3.69%) |
432.55 |
403.00 - 456.00 |
0.3798 times |
DMA SMA EMA moving averages of Sula Vineyards SULA
DMA (daily moving average) of Sula Vineyards SULA
| DMA period | DMA value | | 5 day DMA | 251.12 | | 12 day DMA | 250.9 | | 20 day DMA | 254.98 | | 35 day DMA | 265.43 | | 50 day DMA | 261.94 | | 100 day DMA | 277.58 | | 150 day DMA | 280.82 | | 200 day DMA | 290.75 | EMA (exponential moving average) of Sula Vineyards SULA
| EMA period | EMA current | EMA prev | EMA prev2 | | 5 day EMA | 249.72 | 251.05 | 252.57 | | 12 day EMA | 252.32 | 253.28 | 254.24 | | 20 day EMA | 255.18 | 256.03 | 256.88 | | 35 day EMA | 257.04 | 257.63 | 258.2 | | 50 day EMA | 260.05 | 260.58 | 261.09 |
SMA (simple moving average) of Sula Vineyards SULA
| SMA period | SMA current | SMA prev | SMA prev2 | | 5 day SMA | 251.12 | 252.52 | 253.12 | | 12 day SMA | 250.9 | 251.81 | 252.71 | | 20 day SMA | 254.98 | 255.57 | 256.4 | | 35 day SMA | 265.43 | 265.85 | 265.95 | | 50 day SMA | 261.94 | 261.99 | 262.02 | | 100 day SMA | 277.58 | 278.05 | 278.51 | | 150 day SMA | 280.82 | 281.03 | 281.26 | | 200 day SMA | 290.75 | 291.57 | 292.36 |
|
|
