StylamIndustries STYLAMIND full analysis,charts,indicators,moving averages,SMA,DMA,EMA,ADX,MACD,RSIStylam Industries STYLAMIND WideScreen charts, DMA,SMA,EMA technical analysis, forecast prediction, by indicators ADX,MACD,RSI,CCI NSE stock exchange
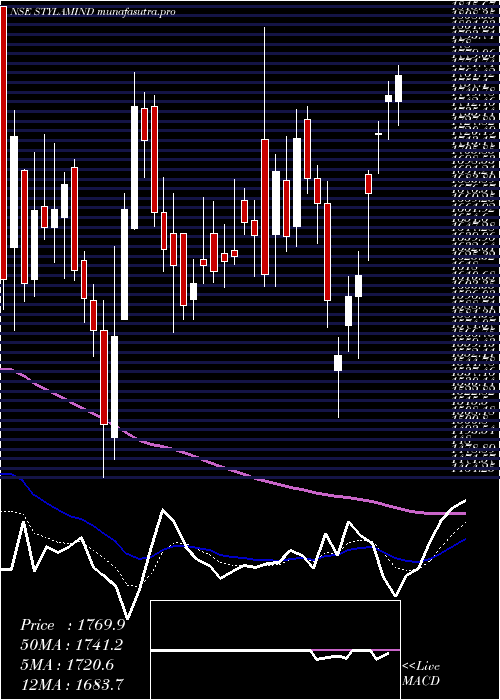
Daily price and charts and targets StylamIndustries Strong Daily Stock price targets for StylamIndustries STYLAMIND are 1993.6 and 2041.3 | Daily Target 1 | 1955.8 | | Daily Target 2 | 1983.7 | | Daily Target 3 | 2003.5 | | Daily Target 4 | 2031.4 | | Daily Target 5 | 2051.2 |
Daily price and volume Stylam Industries
| Date |
Closing |
Open |
Range |
Volume |
Wed 29 October 2025 |
2011.60 (0.85%) |
2000.00 |
1975.60 - 2023.30 |
0.4865 times |
Tue 28 October 2025 |
1994.70 (-2.49%) |
2048.60 |
1965.10 - 2058.70 |
1.0014 times |
Mon 27 October 2025 |
2045.60 (7.37%) |
1913.00 |
1913.00 - 2084.30 |
4.9727 times |
Fri 24 October 2025 |
1905.20 (-0.64%) |
1917.50 |
1880.10 - 1968.00 |
0.6812 times |
Thu 23 October 2025 |
1917.50 (-1.4%) |
1974.00 |
1908.60 - 1983.80 |
0.2838 times |
Tue 21 October 2025 |
1944.80 (2.93%) |
1861.00 |
1861.00 - 1955.10 |
0.1288 times |
Mon 20 October 2025 |
1889.40 (-1.75%) |
1923.10 |
1885.00 - 1973.00 |
0.3852 times |
Fri 17 October 2025 |
1923.10 (-1.49%) |
1952.00 |
1910.30 - 1985.00 |
0.9139 times |
Thu 16 October 2025 |
1952.10 (-2.35%) |
1990.20 |
1945.00 - 2008.30 |
0.6846 times |
Wed 15 October 2025 |
1999.10 (-0.22%) |
2003.60 |
1990.00 - 2022.00 |
0.4619 times |
Tue 14 October 2025 |
2003.60 (-1.06%) |
2020.00 |
1992.50 - 2038.70 |
0.8826 times |
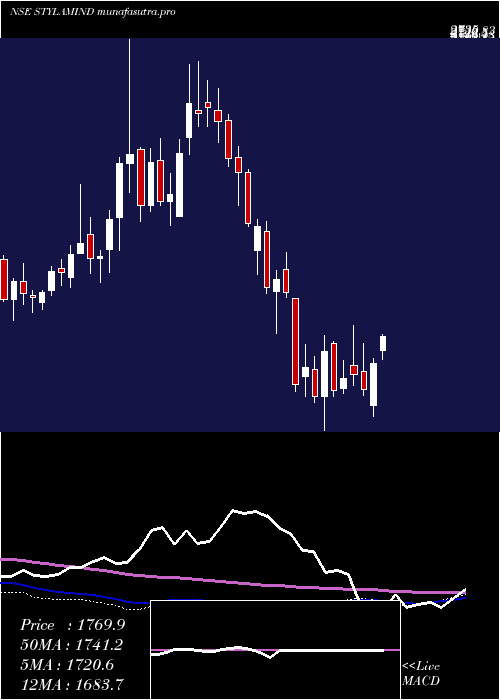
Weekly price and charts StylamIndustries Strong weekly Stock price targets for StylamIndustries STYLAMIND are 1962.3 and 2133.6 | Weekly Target 1 | 1831.67 | | Weekly Target 2 | 1921.63 | | Weekly Target 3 | 2002.9666666667 | | Weekly Target 4 | 2092.93 | | Weekly Target 5 | 2174.27 |
Weekly price and volumes for Stylam Industries
| Date |
Closing |
Open |
Range |
Volume |
Wed 29 October 2025 |
2011.60 (5.58%) |
1913.00 |
1913.00 - 2084.30 |
1.4997 times |
Fri 24 October 2025 |
1905.20 (-0.93%) |
1923.10 |
1861.00 - 1983.80 |
0.3433 times |
Fri 17 October 2025 |
1923.10 (-4.7%) |
1994.90 |
1910.30 - 2038.70 |
0.7956 times |
Fri 10 October 2025 |
2018.00 (17.43%) |
1700.00 |
1700.00 - 2049.90 |
2.8641 times |
Fri 03 October 2025 |
1718.50 (4.01%) |
1652.30 |
1621.00 - 1729.10 |
0.6113 times |
Fri 26 September 2025 |
1652.20 (-3.55%) |
1723.00 |
1625.10 - 1753.00 |
0.3701 times |
Fri 19 September 2025 |
1713.00 (-0.78%) |
1734.30 |
1704.70 - 1779.00 |
0.6051 times |
Fri 12 September 2025 |
1726.40 (4.15%) |
1665.90 |
1665.80 - 1885.00 |
2.0258 times |
Fri 05 September 2025 |
1657.60 (-1.63%) |
1685.00 |
1594.10 - 1711.10 |
0.6082 times |
Fri 29 August 2025 |
1685.10 (3.22%) |
1630.40 |
1630.40 - 1698.10 |
0.2768 times |
Fri 22 August 2025 |
1632.60 (-1.7%) |
1679.80 |
1616.60 - 1685.00 |
0.271 times |
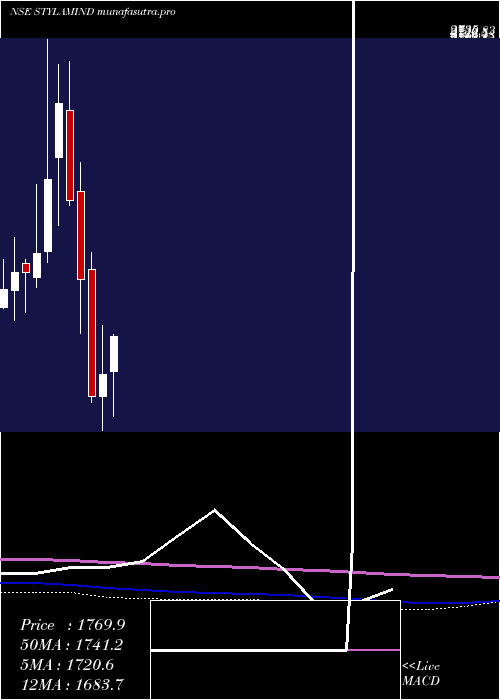
Monthly price and charts StylamIndustries Strong monthly Stock price targets for StylamIndustries STYLAMIND are 1828.55 and 2267.35 | Monthly Target 1 | 1475 | | Monthly Target 2 | 1743.3 | | Monthly Target 3 | 1913.8 | | Monthly Target 4 | 2182.1 | | Monthly Target 5 | 2352.6 |
Monthly price and volumes Stylam Industries
| Date |
Closing |
Open |
Range |
Volume |
Wed 29 October 2025 |
2011.60 (22.15%) |
1646.00 |
1645.50 - 2084.30 |
2.2179 times |
Tue 30 September 2025 |
1646.80 (-2.27%) |
1685.00 |
1594.10 - 1885.00 |
1.4645 times |
Fri 29 August 2025 |
1685.10 (-3.58%) |
1772.50 |
1616.60 - 1870.00 |
0.4597 times |
Thu 31 July 2025 |
1747.70 (6.66%) |
1638.50 |
1600.00 - 1911.30 |
1.0546 times |
Mon 30 June 2025 |
1638.50 (-0.01%) |
1655.00 |
1593.70 - 1783.20 |
0.8326 times |
Fri 30 May 2025 |
1638.60 (3.91%) |
1580.00 |
1522.70 - 1873.00 |
1.0105 times |
Wed 30 April 2025 |
1577.00 (-4.27%) |
1655.00 |
1510.00 - 1835.90 |
0.7151 times |
Fri 28 March 2025 |
1647.35 (4.5%) |
1576.40 |
1464.25 - 1806.20 |
0.9172 times |
Fri 28 February 2025 |
1576.40 (-19.38%) |
1986.85 |
1556.05 - 2044.00 |
0.639 times |
Fri 31 January 2025 |
1955.40 (-11.55%) |
2239.00 |
1780.05 - 2336.00 |
0.6889 times |
Tue 31 December 2024 |
2210.70 (-12.44%) |
2504.75 |
2193.65 - 2661.90 |
1.1742 times |
DMA SMA EMA moving averages of Stylam Industries STYLAMIND
DMA (daily moving average) of Stylam Industries STYLAMIND
| DMA period | DMA value | | 5 day DMA | 1974.92 | | 12 day DMA | 1967.65 | | 20 day DMA | 1912.08 | | 35 day DMA | 1831.44 | | 50 day DMA | 1781.04 | | 100 day DMA | 1742.71 | | 150 day DMA | 1724.52 | | 200 day DMA | 1748.14 | EMA (exponential moving average) of Stylam Industries STYLAMIND
| EMA period | EMA current | EMA prev | EMA prev2 | | 5 day EMA | 1986.44 | 1973.86 | 1963.44 | | 12 day EMA | 1953.36 | 1942.77 | 1933.33 | | 20 day EMA | 1914.69 | 1904.49 | 1895 | | 35 day EMA | 1857.5 | 1848.43 | 1839.82 | | 50 day EMA | 1792.14 | 1783.19 | 1774.56 |
SMA (simple moving average) of Stylam Industries STYLAMIND
| SMA period | SMA current | SMA prev | SMA prev2 | | 5 day SMA | 1974.92 | 1961.56 | 1940.5 | | 12 day SMA | 1967.65 | 1968.18 | 1971.53 | | 20 day SMA | 1912.08 | 1892.99 | 1875.87 | | 35 day SMA | 1831.44 | 1826.4 | 1816.77 | | 50 day SMA | 1781.04 | 1774.03 | 1767.56 | | 100 day SMA | 1742.71 | 1739.4 | 1736.48 | | 150 day SMA | 1724.52 | 1721.96 | 1719.47 | | 200 day SMA | 1748.14 | 1749.42 | 1750.73 |
|
|
