SterliteTechnologies STLTECH full analysis,charts,indicators,moving averages,SMA,DMA,EMA,ADX,MACD,RSISterlite Technologies STLTECH WideScreen charts, DMA,SMA,EMA technical analysis, forecast prediction, by indicators ADX,MACD,RSI,CCI NSE stock exchange
Daily price and charts and targets SterliteTechnologies Strong Daily Stock price targets for SterliteTechnologies STLTECH are 113.8 and 118.44 | Daily Target 1 | 112.85 | | Daily Target 2 | 114.75 | | Daily Target 3 | 117.49333333333 | | Daily Target 4 | 119.39 | | Daily Target 5 | 122.13 |
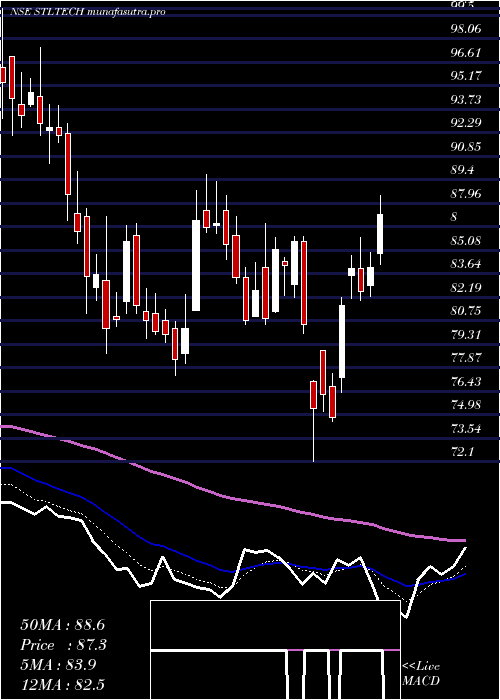
Daily price and volume Sterlite Technologies
| Date |
Closing |
Open |
Range |
Volume |
Tue 28 October 2025 |
116.64 (-2.52%) |
120.22 |
115.60 - 120.24 |
0.8392 times |
Mon 27 October 2025 |
119.65 (-0.37%) |
120.99 |
118.01 - 122.00 |
1.151 times |
Fri 24 October 2025 |
120.09 (4.84%) |
115.00 |
115.00 - 121.00 |
1.5685 times |
Thu 23 October 2025 |
114.55 (-1.88%) |
116.00 |
113.75 - 117.51 |
1.0211 times |
Tue 21 October 2025 |
116.75 (-0.67%) |
117.55 |
113.15 - 119.10 |
0.2497 times |
Mon 20 October 2025 |
117.54 (1.52%) |
115.78 |
113.58 - 118.20 |
1.8204 times |
Fri 17 October 2025 |
115.78 (-1.11%) |
116.08 |
115.52 - 118.00 |
0.5373 times |
Thu 16 October 2025 |
117.08 (-1.2%) |
118.05 |
116.31 - 118.69 |
0.4732 times |
Wed 15 October 2025 |
118.50 (5.21%) |
113.23 |
112.55 - 119.90 |
1.3151 times |
Tue 14 October 2025 |
112.63 (-4.66%) |
117.20 |
110.78 - 119.00 |
1.0247 times |
Mon 13 October 2025 |
118.14 (1.22%) |
116.00 |
116.00 - 118.50 |
0.7275 times |
Weekly price and charts SterliteTechnologies Strong weekly Stock price targets for SterliteTechnologies STLTECH are 112.92 and 119.32 | Weekly Target 1 | 111.68 | | Weekly Target 2 | 114.16 | | Weekly Target 3 | 118.08 | | Weekly Target 4 | 120.56 | | Weekly Target 5 | 124.48 |
Weekly price and volumes for Sterlite Technologies
| Date |
Closing |
Open |
Range |
Volume |
Tue 28 October 2025 |
116.64 (-2.87%) |
120.99 |
115.60 - 122.00 |
0.3038 times |
Fri 24 October 2025 |
120.09 (3.72%) |
115.78 |
113.15 - 121.00 |
0.7112 times |
Fri 17 October 2025 |
115.78 (-0.81%) |
116.00 |
110.78 - 119.90 |
0.6224 times |
Fri 10 October 2025 |
116.72 (-5.28%) |
123.00 |
116.20 - 123.14 |
0.4829 times |
Fri 03 October 2025 |
123.22 (5.24%) |
117.89 |
111.25 - 124.59 |
0.8586 times |
Fri 26 September 2025 |
117.09 (-5.5%) |
124.28 |
115.10 - 126.80 |
0.7869 times |
Fri 19 September 2025 |
123.90 (3.53%) |
120.45 |
120.00 - 126.00 |
0.936 times |
Fri 12 September 2025 |
119.67 (8.81%) |
110.77 |
110.49 - 123.00 |
1.9187 times |
Fri 05 September 2025 |
109.98 (-4.11%) |
110.20 |
105.73 - 117.59 |
2.5175 times |
Fri 29 August 2025 |
114.69 (-12.11%) |
130.90 |
114.11 - 133.49 |
0.8619 times |
Fri 22 August 2025 |
130.49 (-3.19%) |
136.84 |
127.52 - 140.40 |
1.8491 times |

Monthly price and charts SterliteTechnologies Strong monthly Stock price targets for SterliteTechnologies STLTECH are 113.71 and 127.52 | Monthly Target 1 | 103.53 | | Monthly Target 2 | 110.08 | | Monthly Target 3 | 117.33666666667 | | Monthly Target 4 | 123.89 | | Monthly Target 5 | 131.15 |
Monthly price and volumes Sterlite Technologies
| Date |
Closing |
Open |
Range |
Volume |
Tue 28 October 2025 |
116.64 (2.98%) |
113.80 |
110.78 - 124.59 |
0.2399 times |
Tue 30 September 2025 |
113.27 (-1.24%) |
110.20 |
105.73 - 126.80 |
0.5734 times |
Fri 29 August 2025 |
114.69 (-4.35%) |
119.90 |
114.11 - 140.40 |
0.6266 times |
Thu 31 July 2025 |
119.91 (13.94%) |
106.00 |
100.15 - 132.50 |
1.6727 times |
Mon 30 June 2025 |
105.24 (46.29%) |
71.94 |
70.11 - 119.20 |
5.0144 times |
Fri 30 May 2025 |
71.94 (-17.28%) |
59.26 |
59.26 - 78.90 |
0.2018 times |
Wed 23 April 2025 |
86.97 (7.48%) |
81.30 |
72.10 - 88.46 |
0.3174 times |
Fri 28 March 2025 |
80.92 (-6.15%) |
87.15 |
77.41 - 89.76 |
0.8367 times |
Fri 28 February 2025 |
86.22 (-20.65%) |
105.56 |
85.52 - 109.45 |
0.2415 times |
Fri 31 January 2025 |
108.66 (-5.16%) |
114.78 |
98.40 - 118.64 |
0.2756 times |
Tue 31 December 2024 |
114.57 (-2.85%) |
118.00 |
113.32 - 127.80 |
0.3914 times |

DMA SMA EMA moving averages of Sterlite Technologies STLTECH
DMA (daily moving average) of Sterlite Technologies STLTECH
| DMA period | DMA value | | 5 day DMA | 117.54 | | 12 day DMA | 117.01 | | 20 day DMA | 117.76 | | 35 day DMA | 119.14 | | 50 day DMA | 120.04 | | 100 day DMA | 114.65 | | 150 day DMA | 102.39 | | 200 day DMA | 102.98 | EMA (exponential moving average) of Sterlite Technologies STLTECH
| EMA period | EMA current | EMA prev | EMA prev2 | | 5 day EMA | 117.66 | 118.17 | 117.43 | | 12 day EMA | 117.64 | 117.82 | 117.49 | | 20 day EMA | 118.14 | 118.3 | 118.16 | | 35 day EMA | 119.14 | 119.29 | 119.27 | | 50 day EMA | 120.38 | 120.53 | 120.57 |
SMA (simple moving average) of Sterlite Technologies STLTECH
| SMA period | SMA current | SMA prev | SMA prev2 | | 5 day SMA | 117.54 | 117.72 | 116.94 | | 12 day SMA | 117.01 | 117.15 | 117 | | 20 day SMA | 117.76 | 117.78 | 117.98 | | 35 day SMA | 119.14 | 118.95 | 118.6 | | 50 day SMA | 120.04 | 120.28 | 120.4 | | 100 day SMA | 114.65 | 114.22 | 113.75 | | 150 day SMA | 102.39 | 102.17 | 101.93 | | 200 day SMA | 102.98 | 102.98 | 102.99 |
|
|
