StelHoldings STEL full analysis,charts,indicators,moving averages,SMA,DMA,EMA,ADX,MACD,RSIStel Holdings STEL WideScreen charts, DMA,SMA,EMA technical analysis, forecast prediction, by indicators ADX,MACD,RSI,CCI NSE stock exchange
operates under Holding Companies sector
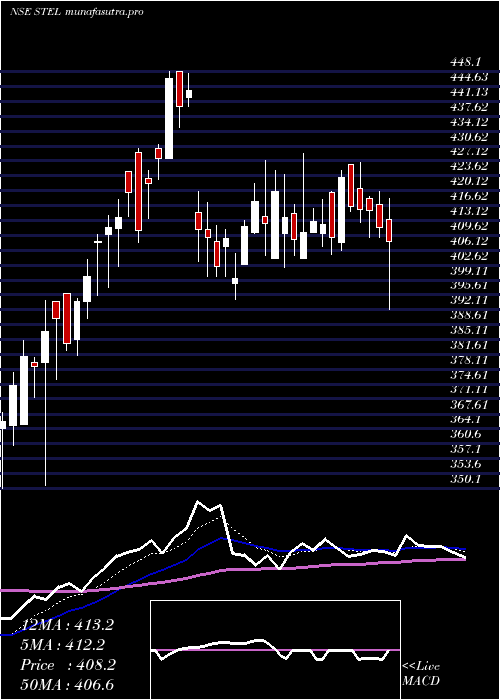
Daily price and charts and targets StelHoldings Strong Daily Stock price targets for StelHoldings STEL are 397.98 and 417.03 | Daily Target 1 | 393.62 | | Daily Target 2 | 402.33 | | Daily Target 3 | 412.66666666667 | | Daily Target 4 | 421.38 | | Daily Target 5 | 431.72 |
Daily price and volume Stel Holdings
| Date |
Closing |
Open |
Range |
Volume |
Tue 28 October 2025 |
411.05 (-1.31%) |
423.00 |
403.95 - 423.00 |
0.9474 times |
Mon 27 October 2025 |
416.50 (2.26%) |
407.10 |
406.95 - 420.90 |
0.6707 times |
Fri 24 October 2025 |
407.30 (-3%) |
419.90 |
405.50 - 430.00 |
0.6242 times |
Thu 23 October 2025 |
419.90 (-2.41%) |
439.00 |
415.00 - 439.00 |
0.7951 times |
Tue 21 October 2025 |
430.25 (3.48%) |
415.85 |
415.00 - 439.45 |
0.5683 times |
Mon 20 October 2025 |
415.80 (2.14%) |
413.45 |
408.00 - 426.95 |
1.0823 times |
Fri 17 October 2025 |
407.10 (-1.38%) |
426.25 |
394.55 - 426.25 |
2.0122 times |
Thu 16 October 2025 |
412.80 (3.33%) |
405.00 |
402.15 - 429.90 |
1.5977 times |
Wed 15 October 2025 |
399.50 (2.36%) |
396.60 |
394.95 - 406.20 |
0.8177 times |
Tue 14 October 2025 |
390.30 (-2.11%) |
399.55 |
388.05 - 402.55 |
0.8844 times |
Mon 13 October 2025 |
398.70 (1.51%) |
397.00 |
385.75 - 400.90 |
0.9361 times |
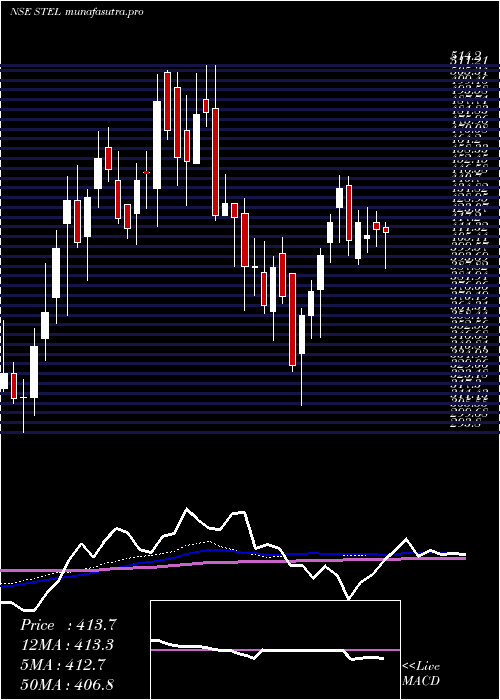
Weekly price and charts StelHoldings Strong weekly Stock price targets for StelHoldings STEL are 407.5 and 426.55 | Weekly Target 1 | 393.62 | | Weekly Target 2 | 402.33 | | Weekly Target 3 | 412.66666666667 | | Weekly Target 4 | 421.38 | | Weekly Target 5 | 431.72 |
Weekly price and volumes for Stel Holdings
| Date |
Closing |
Open |
Range |
Volume |
Tue 28 October 2025 |
411.05 (0.92%) |
407.10 |
403.95 - 423.00 |
0.1952 times |
Fri 24 October 2025 |
407.30 (0.05%) |
413.45 |
405.50 - 439.45 |
0.3703 times |
Fri 17 October 2025 |
407.10 (3.65%) |
397.00 |
385.75 - 429.90 |
0.7538 times |
Fri 10 October 2025 |
392.75 (-9.79%) |
435.50 |
380.00 - 445.95 |
0.6741 times |
Fri 03 October 2025 |
435.35 (-2.05%) |
442.45 |
405.10 - 448.80 |
0.4762 times |
Fri 26 September 2025 |
444.45 (-6.15%) |
426.50 |
426.50 - 487.95 |
0.4107 times |
Fri 19 September 2025 |
473.55 (-9.94%) |
525.00 |
466.60 - 529.95 |
1.4304 times |
Fri 12 September 2025 |
525.80 (12.09%) |
487.80 |
460.00 - 530.00 |
1.8343 times |
Fri 05 September 2025 |
469.10 (1.75%) |
469.70 |
453.65 - 507.15 |
2.2783 times |
Fri 29 August 2025 |
461.05 (6.48%) |
439.35 |
415.70 - 469.80 |
1.5767 times |
Fri 22 August 2025 |
433.00 (-1.83%) |
445.00 |
421.00 - 445.00 |
1.8842 times |
Monthly price and charts StelHoldings Strong monthly Stock price targets for StelHoldings STEL are 362.08 and 428.98 | Monthly Target 1 | 345.75 | | Monthly Target 2 | 378.4 | | Monthly Target 3 | 412.65 | | Monthly Target 4 | 445.3 | | Monthly Target 5 | 479.55 |
Monthly price and volumes Stel Holdings
| Date |
Closing |
Open |
Range |
Volume |
Tue 28 October 2025 |
411.05 (-0.42%) |
431.00 |
380.00 - 446.90 |
0.8127 times |
Tue 30 September 2025 |
412.80 (-10.47%) |
469.70 |
405.10 - 530.00 |
2.3163 times |
Fri 29 August 2025 |
461.05 (11.88%) |
401.20 |
396.05 - 469.80 |
1.639 times |
Thu 31 July 2025 |
412.10 (-0.41%) |
414.70 |
391.35 - 430.90 |
0.3751 times |
Mon 30 June 2025 |
413.80 (-6.72%) |
414.95 |
394.60 - 427.35 |
0.2166 times |
Mon 24 March 2025 |
443.60 (17.14%) |
379.75 |
350.85 - 448.10 |
0.7377 times |
Fri 28 February 2025 |
378.70 (-3.59%) |
401.40 |
310.10 - 411.10 |
0.8896 times |
Fri 31 January 2025 |
392.80 (-3.1%) |
406.10 |
348.95 - 434.50 |
1.3763 times |
Tue 31 December 2024 |
405.35 (-11.24%) |
455.00 |
393.55 - 514.20 |
1.0693 times |
Fri 29 November 2024 |
456.70 (-3.88%) |
500.90 |
430.15 - 509.95 |
0.5674 times |
Tue 13 August 2024 |
475.15 (8.68%) |
455.90 |
417.60 - 510.95 |
2.7284 times |
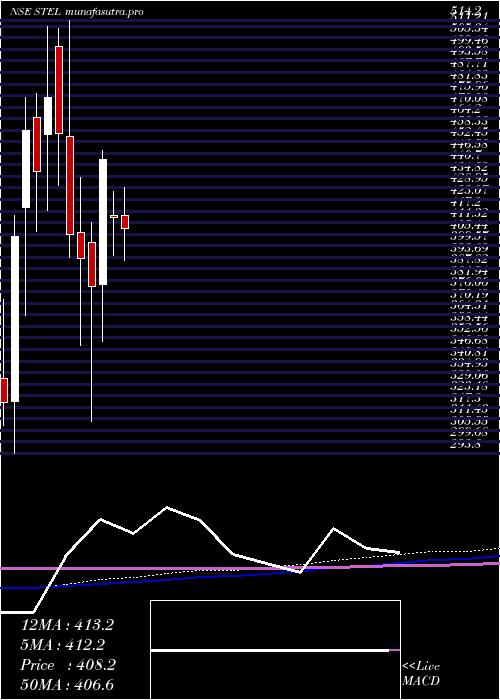
DMA SMA EMA moving averages of Stel Holdings STEL
DMA (daily moving average) of Stel Holdings STEL
| DMA period | DMA value | | 5 day DMA | 417 | | 12 day DMA | 408.5 | | 20 day DMA | 414.08 | | 35 day DMA | 445.89 | | 50 day DMA | 449.3 | | 100 day DMA | 431.92 | | 150 day DMA | 414.77 | | 200 day DMA | 424.49 | EMA (exponential moving average) of Stel Holdings STEL
| EMA period | EMA current | EMA prev | EMA prev2 | | 5 day EMA | 413.53 | 414.77 | 413.91 | | 12 day EMA | 414.93 | 415.63 | 415.47 | | 20 day EMA | 420.95 | 421.99 | 422.57 | | 35 day EMA | 429.76 | 430.86 | 431.71 | | 50 day EMA | 443.88 | 445.22 | 446.39 |
SMA (simple moving average) of Stel Holdings STEL
| SMA period | SMA current | SMA prev | SMA prev2 | | 5 day SMA | 417 | 417.95 | 416.07 | | 12 day SMA | 408.5 | 407.67 | 406.99 | | 20 day SMA | 414.08 | 415.75 | 418.01 | | 35 day SMA | 445.89 | 447.54 | 449.37 | | 50 day SMA | 449.3 | 449.79 | 450.03 | | 100 day SMA | 431.92 | 431.93 | 431.84 | | 150 day SMA | 414.77 | 414.72 | 414.81 | | 200 day SMA | 424.49 | 424.55 | 424.6 |
|
|
