StarCement STARCEMENT full analysis,charts,indicators,moving averages,SMA,DMA,EMA,ADX,MACD,RSIStar Cement STARCEMENT WideScreen charts, DMA,SMA,EMA technical analysis, forecast prediction, by indicators ADX,MACD,RSI,CCI NSE stock exchange
Daily price and charts and targets StarCement Strong Daily Stock price targets for StarCement STARCEMENT are 248.8 and 253.1 | Daily Target 1 | 247.85 | | Daily Target 2 | 249.75 | | Daily Target 3 | 252.15 | | Daily Target 4 | 254.05 | | Daily Target 5 | 256.45 |
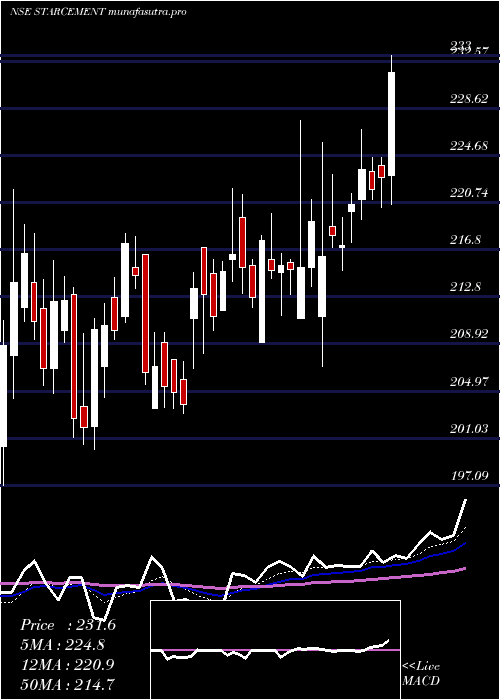
Daily price and volume Star Cement
| Date |
Closing |
Open |
Range |
Volume |
Tue 28 October 2025 |
251.65 (-0.98%) |
254.55 |
250.25 - 254.55 |
0.7262 times |
Mon 27 October 2025 |
254.15 (1.25%) |
251.45 |
250.95 - 255.00 |
0.6604 times |
Fri 24 October 2025 |
251.00 (-1.49%) |
252.60 |
250.25 - 255.75 |
0.7244 times |
Thu 23 October 2025 |
254.80 (-2.69%) |
263.25 |
253.85 - 263.55 |
0.9351 times |
Tue 21 October 2025 |
261.85 (-0.3%) |
262.70 |
261.20 - 264.30 |
0.1787 times |
Mon 20 October 2025 |
262.65 (1.9%) |
260.35 |
254.55 - 264.00 |
1.2783 times |
Fri 17 October 2025 |
257.75 (-0.69%) |
259.55 |
254.95 - 261.80 |
1.2808 times |
Thu 16 October 2025 |
259.55 (0.33%) |
258.75 |
257.35 - 263.50 |
1.1009 times |
Wed 15 October 2025 |
258.70 (-2.84%) |
268.00 |
257.65 - 273.00 |
1.7486 times |
Tue 14 October 2025 |
266.25 (-0.34%) |
267.80 |
263.50 - 269.00 |
1.3667 times |
Mon 13 October 2025 |
267.15 (0.62%) |
265.00 |
261.85 - 270.00 |
1.4074 times |
Weekly price and charts StarCement Strong weekly Stock price targets for StarCement STARCEMENT are 250.95 and 255.7 | Weekly Target 1 | 247.55 | | Weekly Target 2 | 249.6 | | Weekly Target 3 | 252.3 | | Weekly Target 4 | 254.35 | | Weekly Target 5 | 257.05 |
Weekly price and volumes for Star Cement
| Date |
Closing |
Open |
Range |
Volume |
Tue 28 October 2025 |
251.65 (0.26%) |
251.45 |
250.25 - 255.00 |
0.1806 times |
Fri 24 October 2025 |
251.00 (-2.62%) |
260.35 |
250.25 - 264.30 |
0.4058 times |
Fri 17 October 2025 |
257.75 (-2.92%) |
265.00 |
254.95 - 273.00 |
0.8991 times |
Fri 10 October 2025 |
265.50 (4.45%) |
253.20 |
250.20 - 270.20 |
1.1205 times |
Fri 03 October 2025 |
254.20 (0.45%) |
253.05 |
250.05 - 264.00 |
0.6446 times |
Fri 26 September 2025 |
253.05 (-7.46%) |
275.00 |
252.00 - 275.10 |
0.7734 times |
Fri 19 September 2025 |
273.45 (0.48%) |
272.60 |
267.00 - 279.55 |
0.9184 times |
Fri 12 September 2025 |
272.15 (-6.89%) |
292.40 |
268.60 - 293.35 |
1.0276 times |
Fri 05 September 2025 |
292.30 (2.51%) |
285.60 |
283.70 - 308.95 |
2.3048 times |
Fri 29 August 2025 |
285.15 (3.05%) |
282.00 |
276.92 - 291.69 |
1.7252 times |
Fri 22 August 2025 |
276.71 (-4.15%) |
292.29 |
274.40 - 299.99 |
2.225 times |

Monthly price and charts StarCement Strong monthly Stock price targets for StarCement STARCEMENT are 239.38 and 262.33 | Monthly Target 1 | 235.28 | | Monthly Target 2 | 243.47 | | Monthly Target 3 | 258.23333333333 | | Monthly Target 4 | 266.42 | | Monthly Target 5 | 281.18 |
Monthly price and volumes Star Cement
| Date |
Closing |
Open |
Range |
Volume |
Tue 28 October 2025 |
251.65 (-1.04%) |
254.30 |
250.05 - 273.00 |
0.3456 times |
Tue 30 September 2025 |
254.30 (-10.82%) |
285.60 |
250.55 - 308.95 |
0.6601 times |
Fri 29 August 2025 |
285.15 (19.18%) |
239.00 |
239.00 - 300.00 |
2.9674 times |
Thu 31 July 2025 |
239.26 (12.42%) |
212.84 |
209.00 - 244.25 |
0.9032 times |
Mon 30 June 2025 |
212.82 (-2.09%) |
217.80 |
207.41 - 220.90 |
0.2792 times |
Fri 30 May 2025 |
217.37 (-0.45%) |
220.24 |
201.74 - 239.79 |
0.761 times |
Wed 30 April 2025 |
218.35 (1.55%) |
214.92 |
207.00 - 233.00 |
0.6778 times |
Fri 28 March 2025 |
215.02 (6.47%) |
202.00 |
200.10 - 221.95 |
0.6588 times |
Fri 28 February 2025 |
201.96 (-5.41%) |
207.73 |
197.09 - 221.80 |
0.9783 times |
Fri 31 January 2025 |
213.51 (-8.06%) |
232.00 |
196.25 - 234.25 |
1.7685 times |
Tue 31 December 2024 |
232.22 (26.97%) |
183.00 |
179.50 - 247.30 |
9.2546 times |

DMA SMA EMA moving averages of Star Cement STARCEMENT
DMA (daily moving average) of Star Cement STARCEMENT
| DMA period | DMA value | | 5 day DMA | 254.69 | | 12 day DMA | 259.25 | | 20 day DMA | 258.85 | | 35 day DMA | 264.03 | | 50 day DMA | 271.6 | | 100 day DMA | 249.34 | | 150 day DMA | 239.46 | | 200 day DMA | 232.28 | EMA (exponential moving average) of Star Cement STARCEMENT
| EMA period | EMA current | EMA prev | EMA prev2 | | 5 day EMA | 254.35 | 255.7 | 256.47 | | 12 day EMA | 257.47 | 258.53 | 259.33 | | 20 day EMA | 259.93 | 260.8 | 261.5 | | 35 day EMA | 265.03 | 265.82 | 266.51 | | 50 day EMA | 269.98 | 270.73 | 271.41 |
SMA (simple moving average) of Star Cement STARCEMENT
| SMA period | SMA current | SMA prev | SMA prev2 | | 5 day SMA | 254.69 | 256.89 | 257.61 | | 12 day SMA | 259.25 | 260.44 | 261.49 | | 20 day SMA | 258.85 | 258.92 | 259.31 | | 35 day SMA | 264.03 | 265.2 | 266.27 | | 50 day SMA | 271.6 | 272.31 | 273.04 | | 100 day SMA | 249.34 | 248.99 | 248.65 | | 150 day SMA | 239.46 | 239.2 | 238.93 | | 200 day SMA | 232.28 | 232.14 | 232.01 |
|
|
