SaraswatiSaree SSDL full analysis,charts,indicators,moving averages,SMA,DMA,EMA,ADX,MACD,RSISaraswati Saree SSDL WideScreen charts, DMA,SMA,EMA technical analysis, forecast prediction, by indicators ADX,MACD,RSI,CCI NSE stock exchange
Daily price and charts and targets SaraswatiSaree Strong Daily Stock price targets for SaraswatiSaree SSDL are 84.61 and 86.43 | Daily Target 1 | 84.27 | | Daily Target 2 | 84.94 | | Daily Target 3 | 86.086666666667 | | Daily Target 4 | 86.76 | | Daily Target 5 | 87.91 |
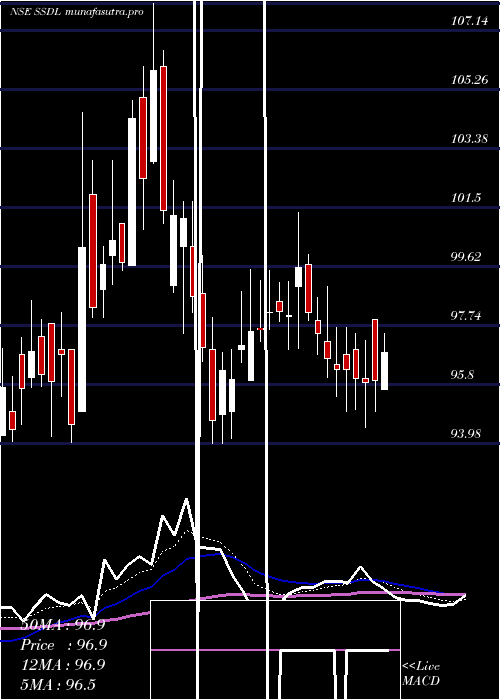
Daily price and volume Saraswati Saree
| Date |
Closing |
Open |
Range |
Volume |
Tue 28 October 2025 |
85.62 (-1.12%) |
86.59 |
85.41 - 87.23 |
1.4943 times |
Mon 27 October 2025 |
86.59 (0.27%) |
85.65 |
85.30 - 87.10 |
1.0231 times |
Fri 24 October 2025 |
86.36 (0.17%) |
87.10 |
85.71 - 87.10 |
0.8763 times |
Thu 23 October 2025 |
86.21 (0.89%) |
85.95 |
85.72 - 87.19 |
1.1664 times |
Tue 21 October 2025 |
85.45 (0.08%) |
85.50 |
85.20 - 85.85 |
0.3746 times |
Mon 20 October 2025 |
85.38 (0.29%) |
86.69 |
84.93 - 86.69 |
0.8732 times |
Fri 17 October 2025 |
85.13 (-1.24%) |
86.25 |
84.95 - 86.66 |
1.0356 times |
Thu 16 October 2025 |
86.20 (0.55%) |
85.70 |
85.11 - 86.50 |
0.7837 times |
Wed 15 October 2025 |
85.73 (-0.67%) |
86.30 |
85.11 - 87.00 |
0.9031 times |
Tue 14 October 2025 |
86.31 (-0.27%) |
86.54 |
85.00 - 87.25 |
1.4698 times |
Mon 13 October 2025 |
86.54 (-0.9%) |
86.25 |
86.00 - 87.50 |
0.9785 times |
Weekly price and charts SaraswatiSaree Strong weekly Stock price targets for SaraswatiSaree SSDL are 84.5 and 86.43 | Weekly Target 1 | 84.12 | | Weekly Target 2 | 84.87 | | Weekly Target 3 | 86.05 | | Weekly Target 4 | 86.8 | | Weekly Target 5 | 87.98 |
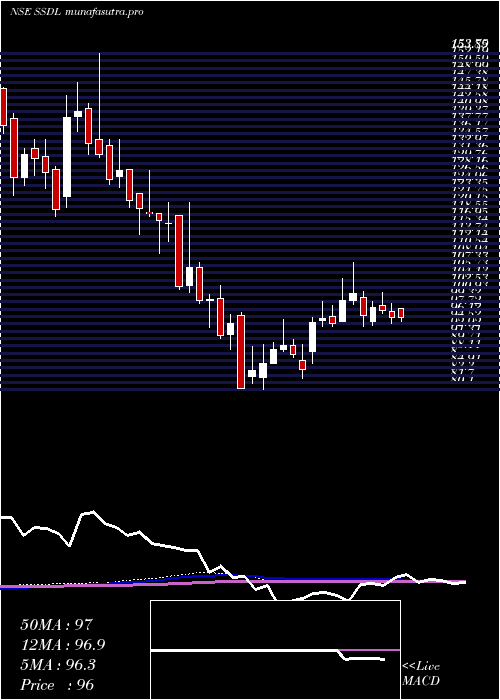
Weekly price and volumes for Saraswati Saree
| Date |
Closing |
Open |
Range |
Volume |
Tue 28 October 2025 |
85.62 (-0.86%) |
85.65 |
85.30 - 87.23 |
0.3827 times |
Fri 24 October 2025 |
86.36 (1.44%) |
86.69 |
84.93 - 87.19 |
0.5003 times |
Fri 17 October 2025 |
85.13 (-2.52%) |
86.25 |
84.95 - 87.50 |
0.7862 times |
Fri 10 October 2025 |
87.33 (-1.56%) |
89.78 |
85.75 - 90.00 |
1.0407 times |
Fri 03 October 2025 |
88.71 (1.85%) |
85.20 |
85.10 - 90.69 |
1.0071 times |
Fri 26 September 2025 |
87.10 (-3.09%) |
89.55 |
85.30 - 91.20 |
1.2676 times |
Fri 19 September 2025 |
89.88 (0.77%) |
90.37 |
88.21 - 91.69 |
1.3583 times |
Fri 12 September 2025 |
89.19 (0.22%) |
90.64 |
88.45 - 91.90 |
1.2668 times |
Fri 05 September 2025 |
88.99 (0.16%) |
89.45 |
88.56 - 91.63 |
1.2824 times |
Fri 29 August 2025 |
88.85 (-3.96%) |
92.55 |
88.10 - 95.83 |
1.1078 times |
Fri 22 August 2025 |
92.51 (-1.21%) |
94.10 |
88.35 - 98.00 |
1.8931 times |
Monthly price and charts SaraswatiSaree Strong monthly Stock price targets for SaraswatiSaree SSDL are 82.52 and 88.03 | Monthly Target 1 | 81.49 | | Monthly Target 2 | 83.55 | | Monthly Target 3 | 86.996666666667 | | Monthly Target 4 | 89.06 | | Monthly Target 5 | 92.51 |
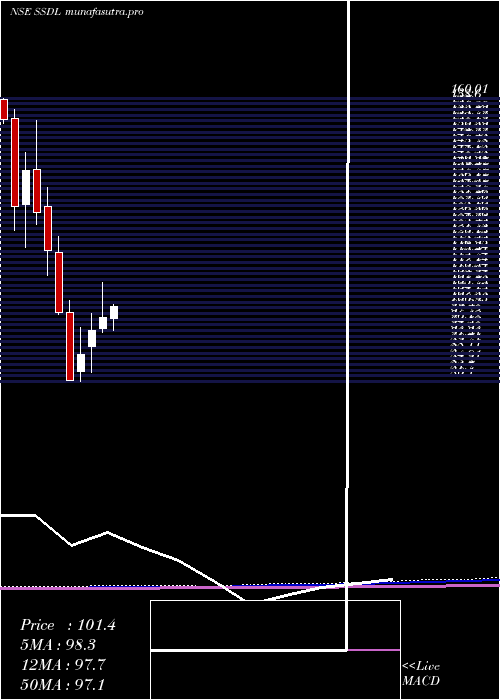
Monthly price and volumes Saraswati Saree
| Date |
Closing |
Open |
Range |
Volume |
Tue 28 October 2025 |
85.62 (-1.43%) |
86.86 |
84.93 - 90.44 |
0.4297 times |
Tue 30 September 2025 |
86.86 (-2.24%) |
89.45 |
85.10 - 91.90 |
0.732 times |
Fri 29 August 2025 |
88.85 (-4.56%) |
93.10 |
88.10 - 98.00 |
0.6357 times |
Thu 31 July 2025 |
93.10 (-5.19%) |
98.05 |
92.06 - 102.59 |
0.7118 times |
Mon 30 June 2025 |
98.20 (3.81%) |
95.00 |
93.98 - 108.00 |
1.0082 times |
Fri 30 May 2025 |
94.60 (7.87%) |
90.00 |
82.60 - 99.36 |
0.9081 times |
Wed 30 April 2025 |
87.70 (9.01%) |
83.00 |
80.10 - 95.50 |
1.4486 times |
Fri 28 March 2025 |
80.45 (-19.19%) |
99.55 |
80.31 - 103.03 |
1.9685 times |
Fri 28 February 2025 |
99.55 (-14.99%) |
116.49 |
99.00 - 121.03 |
1.1333 times |
Fri 31 January 2025 |
117.10 (-8.34%) |
129.69 |
110.00 - 135.00 |
1.0242 times |
Tue 31 December 2024 |
127.76 (-8.64%) |
139.90 |
124.41 - 153.85 |
2.8706 times |
DMA SMA EMA moving averages of Saraswati Saree SSDL
DMA (daily moving average) of Saraswati Saree SSDL
| DMA period | DMA value | | 5 day DMA | 86.05 | | 12 day DMA | 86.07 | | 20 day DMA | 86.59 | | 35 day DMA | 87.68 | | 50 day DMA | 88.8 | | 100 day DMA | 92.77 | | 150 day DMA | 92.12 | | 200 day DMA | 96.59 | EMA (exponential moving average) of Saraswati Saree SSDL
| EMA period | EMA current | EMA prev | EMA prev2 | | 5 day EMA | 86.01 | 86.2 | 86.01 | | 12 day EMA | 86.23 | 86.34 | 86.29 | | 20 day EMA | 86.69 | 86.8 | 86.82 | | 35 day EMA | 87.62 | 87.74 | 87.81 | | 50 day EMA | 88.66 | 88.78 | 88.87 |
SMA (simple moving average) of Saraswati Saree SSDL
| SMA period | SMA current | SMA prev | SMA prev2 | | 5 day SMA | 86.05 | 86 | 85.71 | | 12 day SMA | 86.07 | 86.14 | 86.13 | | 20 day SMA | 86.59 | 86.67 | 86.76 | | 35 day SMA | 87.68 | 87.78 | 87.87 | | 50 day SMA | 88.8 | 88.91 | 89 | | 100 day SMA | 92.77 | 92.91 | 93.03 | | 150 day SMA | 92.12 | 92.17 | 92.2 | | 200 day SMA | 96.59 | 96.78 | 96.99 |
|
|
