SrmContractors SRM full analysis,charts,indicators,moving averages,SMA,DMA,EMA,ADX,MACD,RSISrm Contractors SRM WideScreen charts, DMA,SMA,EMA technical analysis, forecast prediction, by indicators ADX,MACD,RSI,CCI NSE stock exchange
Daily price and charts and targets SrmContractors Strong Daily Stock price targets for SrmContractors SRM are 548.33 and 589.18 | Daily Target 1 | 514.7 | | Daily Target 2 | 541.1 | | Daily Target 3 | 555.55 | | Daily Target 4 | 581.95 | | Daily Target 5 | 596.4 |
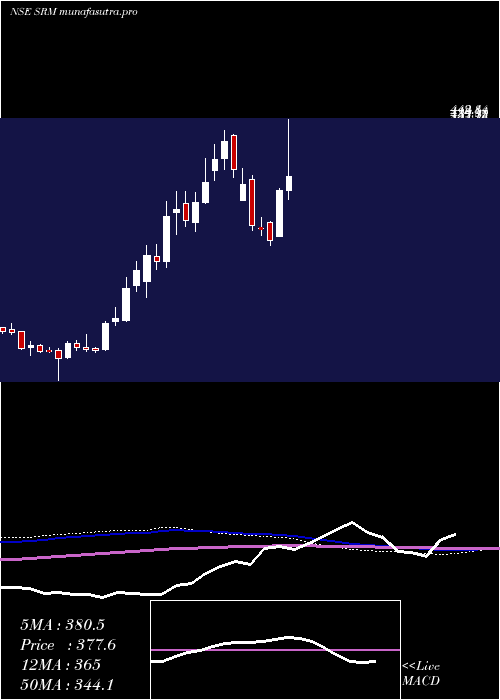
Daily price and volume Srm Contractors
| Date |
Closing |
Open |
Range |
Volume |
Wed 29 October 2025 |
567.50 (5.73%) |
535.00 |
529.15 - 570.00 |
1.8729 times |
Tue 28 October 2025 |
536.75 (-0.99%) |
543.00 |
535.40 - 545.05 |
0.3906 times |
Mon 27 October 2025 |
542.10 (0.7%) |
539.95 |
536.40 - 545.50 |
0.4679 times |
Fri 24 October 2025 |
538.35 (-2.06%) |
550.00 |
535.00 - 550.65 |
0.6063 times |
Thu 23 October 2025 |
549.70 (1.1%) |
546.95 |
535.50 - 555.00 |
0.9385 times |
Tue 21 October 2025 |
543.70 (1.14%) |
542.35 |
539.15 - 551.00 |
0.3269 times |
Mon 20 October 2025 |
537.55 (-0.39%) |
539.65 |
528.60 - 544.50 |
1.1595 times |
Fri 17 October 2025 |
539.65 (-1.63%) |
553.00 |
533.00 - 553.00 |
1.1231 times |
Thu 16 October 2025 |
548.60 (-3.12%) |
563.00 |
537.00 - 568.25 |
2.2293 times |
Wed 15 October 2025 |
566.25 (3.48%) |
550.95 |
548.55 - 569.00 |
0.8852 times |
Tue 14 October 2025 |
547.20 (-2.68%) |
565.00 |
545.40 - 571.50 |
1.5064 times |

Weekly price and charts SrmContractors Strong weekly Stock price targets for SrmContractors SRM are 548.33 and 589.18 | Weekly Target 1 | 514.7 | | Weekly Target 2 | 541.1 | | Weekly Target 3 | 555.55 | | Weekly Target 4 | 581.95 | | Weekly Target 5 | 596.4 |
Weekly price and volumes for Srm Contractors
| Date |
Closing |
Open |
Range |
Volume |
Wed 29 October 2025 |
567.50 (5.41%) |
539.95 |
529.15 - 570.00 |
0.1982 times |
Fri 24 October 2025 |
538.35 (-0.24%) |
539.65 |
528.60 - 555.00 |
0.22 times |
Fri 17 October 2025 |
539.65 (-2.96%) |
550.00 |
533.00 - 571.50 |
0.4812 times |
Fri 10 October 2025 |
556.10 (0.33%) |
566.00 |
529.85 - 584.90 |
1.0749 times |
Fri 03 October 2025 |
554.25 (1.51%) |
546.90 |
521.15 - 558.70 |
0.2677 times |
Fri 26 September 2025 |
546.00 (-2.4%) |
557.95 |
538.00 - 574.20 |
0.965 times |
Fri 19 September 2025 |
559.45 (14.44%) |
491.00 |
474.60 - 575.20 |
5.7062 times |
Fri 12 September 2025 |
488.85 (-1.67%) |
500.05 |
485.10 - 523.00 |
0.6092 times |
Fri 05 September 2025 |
497.15 (7.45%) |
465.00 |
452.30 - 505.00 |
0.3456 times |
Fri 29 August 2025 |
462.70 (-5.47%) |
485.20 |
456.10 - 494.40 |
0.132 times |
Fri 22 August 2025 |
489.50 (4.64%) |
476.50 |
475.80 - 504.00 |
0.3379 times |
Monthly price and charts SrmContractors Strong monthly Stock price targets for SrmContractors SRM are 544.33 and 608.08 | Monthly Target 1 | 494.1 | | Monthly Target 2 | 530.8 | | Monthly Target 3 | 557.85 | | Monthly Target 4 | 594.55 | | Monthly Target 5 | 621.6 |
Monthly price and volumes Srm Contractors
| Date |
Closing |
Open |
Range |
Volume |
Wed 29 October 2025 |
567.50 (6.34%) |
531.30 |
521.15 - 584.90 |
0.9279 times |
Tue 30 September 2025 |
533.65 (15.33%) |
465.00 |
452.30 - 575.20 |
3.3733 times |
Fri 29 August 2025 |
462.70 (-2.03%) |
472.30 |
451.00 - 504.00 |
0.3214 times |
Thu 31 July 2025 |
472.30 (-5.16%) |
505.00 |
431.00 - 531.00 |
0.9194 times |
Mon 30 June 2025 |
498.00 (12.33%) |
460.00 |
401.25 - 507.85 |
1.2087 times |
Fri 30 May 2025 |
443.35 (41.78%) |
312.10 |
298.35 - 451.00 |
0.9241 times |
Wed 30 April 2025 |
312.70 (-18.9%) |
350.00 |
309.85 - 386.90 |
0.1914 times |
Tue 07 January 2025 |
385.55 (-3.2%) |
403.95 |
376.10 - 430.90 |
0.2016 times |
Tue 31 December 2024 |
398.30 (17.16%) |
347.00 |
313.75 - 414.20 |
1.0963 times |
Fri 29 November 2024 |
339.95 (21.85%) |
280.00 |
272.75 - 360.10 |
0.8358 times |
Tue 13 August 2024 |
279.00 (4.51%) |
267.85 |
238.05 - 299.00 |
0.7246 times |

DMA SMA EMA moving averages of Srm Contractors SRM
DMA (daily moving average) of Srm Contractors SRM
| DMA period | DMA value | | 5 day DMA | 546.88 | | 12 day DMA | 548.3 | | 20 day DMA | 549.57 | | 35 day DMA | 540.79 | | 50 day DMA | 522.77 | | 100 day DMA | 497 | | 150 day DMA | 455.91 | | 200 day DMA | 411.13 | EMA (exponential moving average) of Srm Contractors SRM
| EMA period | EMA current | EMA prev | EMA prev2 | | 5 day EMA | 549.91 | 541.12 | 543.31 | | 12 day EMA | 548.11 | 544.58 | 546 | | 20 day EMA | 545.57 | 543.26 | 543.95 | | 35 day EMA | 533.55 | 531.55 | 531.24 | | 50 day EMA | 520.99 | 519.09 | 518.37 |
SMA (simple moving average) of Srm Contractors SRM
| SMA period | SMA current | SMA prev | SMA prev2 | | 5 day SMA | 546.88 | 542.12 | 542.28 | | 12 day SMA | 548.3 | 547.35 | 550.16 | | 20 day SMA | 549.57 | 548.38 | 548.84 | | 35 day SMA | 540.79 | 539.01 | 537.88 | | 50 day SMA | 522.77 | 520.78 | 519.41 | | 100 day SMA | 497 | 495.74 | 494.78 | | 150 day SMA | 455.91 | 454.63 | 453.55 | | 200 day SMA | 411.13 | 409.17 | 407.38 |
|
|
