SpmlInfra SPMLINFRA full analysis,charts,indicators,moving averages,SMA,DMA,EMA,ADX,MACD,RSISpml Infra SPMLINFRA WideScreen charts, DMA,SMA,EMA technical analysis, forecast prediction, by indicators ADX,MACD,RSI,CCI NSE stock exchange
operates under Construction & Engineering sector
Daily price and charts and targets SpmlInfra Strong Daily Stock price targets for SpmlInfra SPMLINFRA are 221.39 and 232.19 | Daily Target 1 | 219.36 | | Daily Target 2 | 223.42 | | Daily Target 3 | 230.16 | | Daily Target 4 | 234.22 | | Daily Target 5 | 240.96 |
Daily price and volume Spml Infra
| Date |
Closing |
Open |
Range |
Volume |
Tue 28 October 2025 |
227.48 (-0.98%) |
229.75 |
226.10 - 236.90 |
0.7292 times |
Mon 27 October 2025 |
229.73 (3.44%) |
224.80 |
223.30 - 240.24 |
1.9404 times |
Fri 24 October 2025 |
222.09 (-1.72%) |
224.50 |
219.01 - 225.85 |
0.6204 times |
Thu 23 October 2025 |
225.97 (-1.9%) |
234.49 |
224.55 - 236.50 |
0.6641 times |
Tue 21 October 2025 |
230.35 (2.88%) |
225.10 |
225.10 - 232.00 |
0.3294 times |
Mon 20 October 2025 |
223.91 (2.87%) |
219.00 |
213.22 - 229.49 |
1.4913 times |
Fri 17 October 2025 |
217.66 (-2.6%) |
225.90 |
209.43 - 228.78 |
1.3161 times |
Thu 16 October 2025 |
223.47 (-3.08%) |
234.00 |
219.11 - 236.80 |
1.8374 times |
Wed 15 October 2025 |
230.57 (0.12%) |
230.50 |
230.03 - 234.52 |
0.3879 times |
Tue 14 October 2025 |
230.29 (-2.05%) |
235.50 |
224.99 - 238.92 |
0.6839 times |
Mon 13 October 2025 |
235.12 (-2.49%) |
239.90 |
234.16 - 239.90 |
0.3953 times |
Weekly price and charts SpmlInfra Strong weekly Stock price targets for SpmlInfra SPMLINFRA are 225.39 and 242.33 | Weekly Target 1 | 213.4 | | Weekly Target 2 | 220.44 | | Weekly Target 3 | 230.34 | | Weekly Target 4 | 237.38 | | Weekly Target 5 | 247.28 |
Weekly price and volumes for Spml Infra
| Date |
Closing |
Open |
Range |
Volume |
Tue 28 October 2025 |
227.48 (2.43%) |
224.80 |
223.30 - 240.24 |
0.4085 times |
Fri 24 October 2025 |
222.09 (2.04%) |
219.00 |
213.22 - 236.50 |
0.4752 times |
Fri 17 October 2025 |
217.66 (-9.73%) |
239.90 |
209.43 - 239.90 |
0.707 times |
Fri 10 October 2025 |
241.13 (-1.33%) |
244.37 |
227.41 - 250.65 |
1.0383 times |
Fri 03 October 2025 |
244.37 (-0.42%) |
250.05 |
235.24 - 251.00 |
0.6039 times |
Fri 26 September 2025 |
245.40 (-13.09%) |
280.40 |
243.75 - 284.00 |
1.0154 times |
Fri 19 September 2025 |
282.35 (-0.42%) |
282.75 |
266.10 - 288.10 |
1.2876 times |
Fri 12 September 2025 |
283.55 (-3.03%) |
299.90 |
275.65 - 302.00 |
1.5439 times |
Fri 05 September 2025 |
292.40 (12.16%) |
261.95 |
261.95 - 297.00 |
2.0757 times |
Fri 29 August 2025 |
260.70 (-6.44%) |
279.95 |
257.80 - 281.45 |
0.8446 times |
Fri 22 August 2025 |
278.65 (-0.46%) |
286.00 |
272.85 - 309.90 |
2.6923 times |
Monthly price and charts SpmlInfra Strong monthly Stock price targets for SpmlInfra SPMLINFRA are 197.85 and 239.07 | Monthly Target 1 | 187.97 | | Monthly Target 2 | 207.72 | | Monthly Target 3 | 229.18666666667 | | Monthly Target 4 | 248.94 | | Monthly Target 5 | 270.41 |
Monthly price and volumes Spml Infra
| Date |
Closing |
Open |
Range |
Volume |
Tue 28 October 2025 |
227.48 (-4%) |
236.50 |
209.43 - 250.65 |
0.4629 times |
Tue 30 September 2025 |
236.95 (-9.11%) |
261.95 |
235.95 - 302.00 |
0.9864 times |
Fri 29 August 2025 |
260.70 (-15.35%) |
313.70 |
257.80 - 323.40 |
1.3542 times |
Thu 31 July 2025 |
307.97 (26.38%) |
243.50 |
227.82 - 314.89 |
3.1026 times |
Mon 30 June 2025 |
243.69 (31.58%) |
184.29 |
180.86 - 258.90 |
1.3249 times |
Fri 30 May 2025 |
185.20 (2.96%) |
179.89 |
155.00 - 201.50 |
0.3599 times |
Wed 30 April 2025 |
179.88 (13.29%) |
155.99 |
154.51 - 226.90 |
1.0986 times |
Fri 28 March 2025 |
158.78 (-37%) |
160.55 |
151.15 - 164.79 |
0.1799 times |
Mon 30 December 2024 |
252.05 (15.56%) |
226.00 |
216.00 - 289.67 |
0.8316 times |
Fri 29 November 2024 |
218.12 (17.62%) |
191.11 |
187.00 - 218.12 |
0.299 times |
Fri 02 August 2024 |
185.45 (-5.42%) |
199.00 |
178.00 - 199.00 |
0.0208 times |
DMA SMA EMA moving averages of Spml Infra SPMLINFRA
DMA (daily moving average) of Spml Infra SPMLINFRA
| DMA period | DMA value | | 5 day DMA | 227.12 | | 12 day DMA | 228.15 | | 20 day DMA | 232.77 | | 35 day DMA | 250.09 | | 50 day DMA | 259.34 | | 100 day DMA | 257.84 | | 150 day DMA | 234.95 | | 200 day DMA | 226.36 | EMA (exponential moving average) of Spml Infra SPMLINFRA
| EMA period | EMA current | EMA prev | EMA prev2 | | 5 day EMA | 226.96 | 226.7 | 225.18 | | 12 day EMA | 229.66 | 230.06 | 230.12 | | 20 day EMA | 235.32 | 236.14 | 236.81 | | 35 day EMA | 245.74 | 246.82 | 247.83 | | 50 day EMA | 257.87 | 259.11 | 260.31 |
SMA (simple moving average) of Spml Infra SPMLINFRA
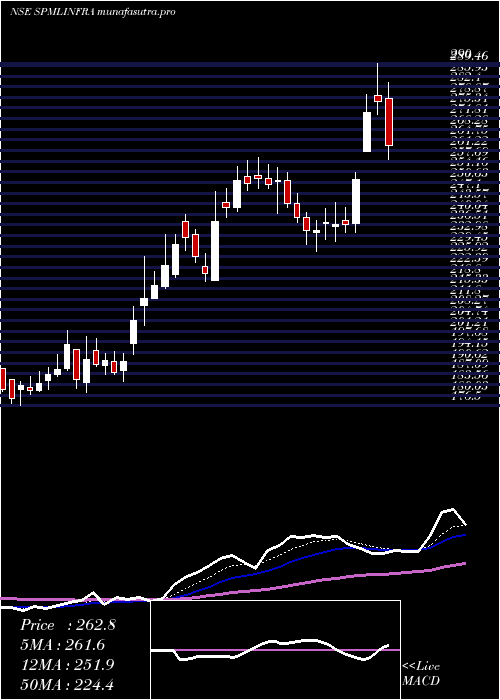
| SMA period | SMA current | SMA prev | SMA prev2 | | 5 day SMA | 227.12 | 226.41 | 224 | | 12 day SMA | 228.15 | 228.83 | 230.31 | | 20 day SMA | 232.77 | 233.67 | 234.88 | | 35 day SMA | 250.09 | 251.95 | 253.54 | | 50 day SMA | 259.34 | 260.46 | 261.61 | | 100 day SMA | 257.84 | 257.49 | 257.09 | | 150 day SMA | 234.95 | 235.16 | 235.39 | | 200 day SMA | 226.36 | 226.03 | 225.66 |
|
|
