SouthernPetrochemicals SPIC full analysis,charts,indicators,moving averages,SMA,DMA,EMA,ADX,MACD,RSISouthern Petrochemicals SPIC WideScreen charts, DMA,SMA,EMA technical analysis, forecast prediction, by indicators ADX,MACD,RSI,CCI NSE stock exchange
Daily price and charts and targets SouthernPetrochemicals Strong Daily Stock price targets for SouthernPetrochemicals SPIC are 90.95 and 93.95 | Daily Target 1 | 88.63 | | Daily Target 2 | 90.26 | | Daily Target 3 | 91.63 | | Daily Target 4 | 93.26 | | Daily Target 5 | 94.63 |
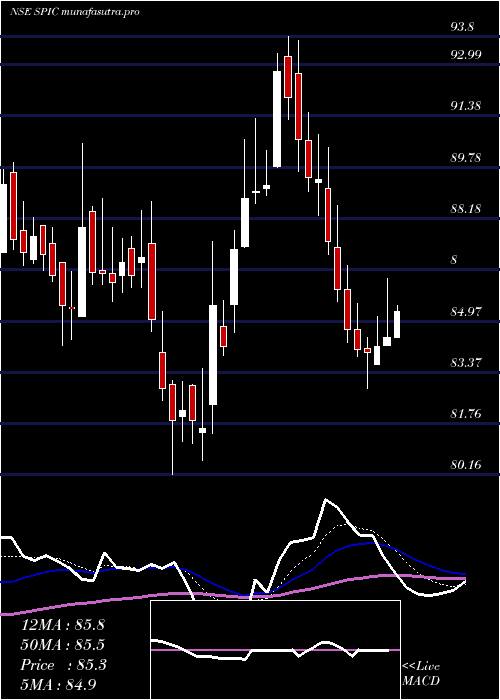
Daily price and volume Southern Petrochemicals
| Date |
Closing |
Open |
Range |
Volume |
Tue 28 October 2025 |
91.89 (2.37%) |
90.12 |
90.00 - 93.00 |
1.8113 times |
Mon 27 October 2025 |
89.76 (0.31%) |
89.48 |
89.20 - 90.80 |
0.4521 times |
Fri 24 October 2025 |
89.48 (-1.41%) |
90.82 |
89.16 - 91.73 |
0.7742 times |
Thu 23 October 2025 |
90.76 (1.33%) |
90.69 |
90.21 - 93.41 |
1.602 times |
Tue 21 October 2025 |
89.57 (0.43%) |
89.98 |
89.20 - 90.42 |
0.2456 times |
Mon 20 October 2025 |
89.19 (-0.5%) |
90.09 |
88.50 - 90.22 |
0.6583 times |
Fri 17 October 2025 |
89.64 (-1.97%) |
91.44 |
89.21 - 91.48 |
0.6485 times |
Thu 16 October 2025 |
91.44 (0.08%) |
91.50 |
90.71 - 93.44 |
1.0659 times |
Wed 15 October 2025 |
91.37 (3.5%) |
88.99 |
88.28 - 91.80 |
1.2869 times |
Tue 14 October 2025 |
88.28 (-3.72%) |
92.00 |
87.35 - 92.23 |
1.4552 times |
Mon 13 October 2025 |
91.69 (-1.47%) |
93.45 |
91.50 - 93.89 |
1.0448 times |
Weekly price and charts SouthernPetrochemicals Strong weekly Stock price targets for SouthernPetrochemicals SPIC are 90.55 and 94.35 | Weekly Target 1 | 87.56 | | Weekly Target 2 | 89.73 | | Weekly Target 3 | 91.363333333333 | | Weekly Target 4 | 93.53 | | Weekly Target 5 | 95.16 |
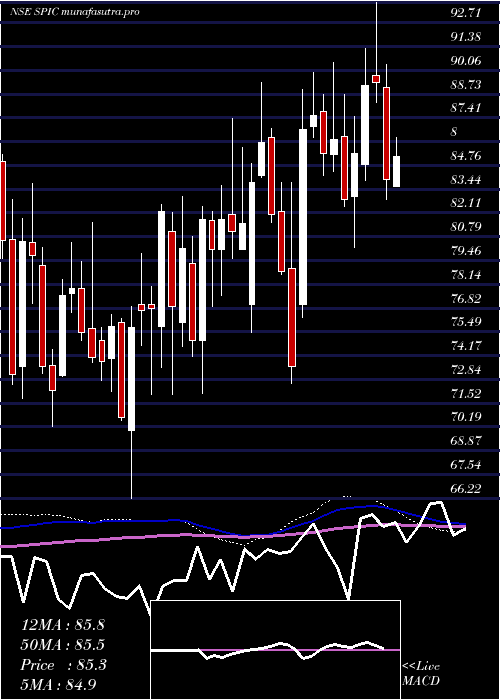
Weekly price and volumes for Southern Petrochemicals
| Date |
Closing |
Open |
Range |
Volume |
Tue 28 October 2025 |
91.89 (2.69%) |
89.48 |
89.20 - 93.00 |
0.2384 times |
Fri 24 October 2025 |
89.48 (-0.18%) |
90.09 |
88.50 - 93.41 |
0.3455 times |
Fri 17 October 2025 |
89.64 (-3.68%) |
93.45 |
87.35 - 93.89 |
0.5795 times |
Fri 10 October 2025 |
93.06 (-2.22%) |
95.66 |
92.55 - 96.83 |
0.7001 times |
Fri 03 October 2025 |
95.17 (3.39%) |
92.65 |
90.26 - 96.50 |
0.9658 times |
Fri 26 September 2025 |
92.05 (-8.32%) |
100.70 |
91.40 - 102.65 |
0.8474 times |
Fri 19 September 2025 |
100.40 (-6.43%) |
107.45 |
99.13 - 108.99 |
0.7946 times |
Fri 12 September 2025 |
107.30 (-7.24%) |
116.60 |
106.00 - 124.00 |
0.9871 times |
Fri 05 September 2025 |
115.68 (7.17%) |
112.50 |
109.85 - 128.20 |
3.5088 times |
Fri 29 August 2025 |
107.94 (-2.21%) |
111.40 |
102.63 - 117.25 |
1.0327 times |
Fri 22 August 2025 |
110.38 (30.57%) |
87.38 |
87.00 - 117.40 |
7.234 times |
Monthly price and charts SouthernPetrochemicals Strong monthly Stock price targets for SouthernPetrochemicals SPIC are 89.62 and 99.1 | Monthly Target 1 | 82.54 | | Monthly Target 2 | 87.22 | | Monthly Target 3 | 92.023333333333 | | Monthly Target 4 | 96.7 | | Monthly Target 5 | 101.5 |
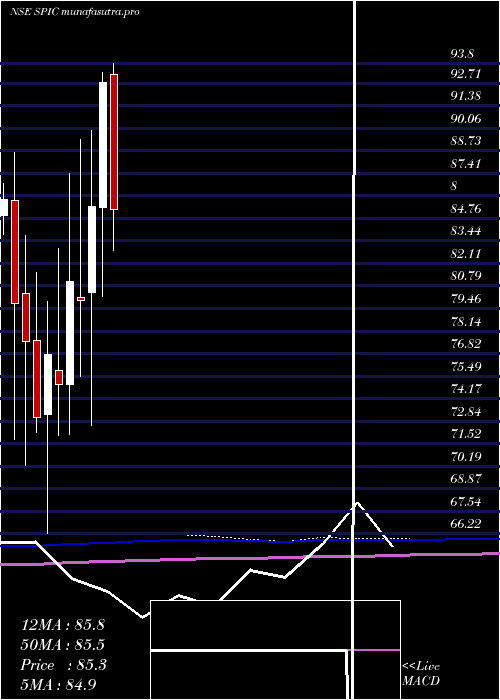
Monthly price and volumes Southern Petrochemicals
| Date |
Closing |
Open |
Range |
Volume |
Tue 28 October 2025 |
91.89 (0.68%) |
91.70 |
87.35 - 96.83 |
0.7034 times |
Tue 30 September 2025 |
91.27 (-15.44%) |
112.50 |
90.48 - 128.20 |
1.7965 times |
Fri 29 August 2025 |
107.94 (9.8%) |
98.00 |
84.15 - 117.40 |
2.6656 times |
Thu 31 July 2025 |
98.31 (5.99%) |
93.23 |
82.87 - 105.30 |
1.6241 times |
Mon 30 June 2025 |
92.75 (8.54%) |
85.39 |
80.16 - 93.33 |
0.7248 times |
Fri 30 May 2025 |
85.45 (6.92%) |
80.40 |
72.60 - 89.95 |
0.7519 times |
Wed 30 April 2025 |
79.92 (-1.41%) |
80.10 |
75.47 - 89.40 |
0.4169 times |
Fri 28 March 2025 |
81.06 (8.08%) |
75.00 |
72.03 - 87.40 |
0.3929 times |
Fri 28 February 2025 |
75.00 (-2.31%) |
75.81 |
72.02 - 83.00 |
0.5212 times |
Fri 31 January 2025 |
76.77 (5.08%) |
73.25 |
66.22 - 79.85 |
0.4025 times |
Tue 31 December 2024 |
73.06 (-5.78%) |
77.60 |
72.18 - 81.56 |
0.3921 times |
DMA SMA EMA moving averages of Southern Petrochemicals SPIC
DMA (daily moving average) of Southern Petrochemicals SPIC
| DMA period | DMA value | | 5 day DMA | 90.29 | | 12 day DMA | 90.51 | | 20 day DMA | 91.77 | | 35 day DMA | 96.78 | | 50 day DMA | 100.56 | | 100 day DMA | 94.34 | | 150 day DMA | 90.74 | | 200 day DMA | 87.3 | EMA (exponential moving average) of Southern Petrochemicals SPIC
| EMA period | EMA current | EMA prev | EMA prev2 | | 5 day EMA | 90.58 | 89.93 | 90.02 | | 12 day EMA | 91.09 | 90.95 | 91.17 | | 20 day EMA | 92.47 | 92.53 | 92.82 | | 35 day EMA | 95.25 | 95.45 | 95.79 | | 50 day EMA | 98.42 | 98.69 | 99.05 |
SMA (simple moving average) of Southern Petrochemicals SPIC
| SMA period | SMA current | SMA prev | SMA prev2 | | 5 day SMA | 90.29 | 89.75 | 89.73 | | 12 day SMA | 90.51 | 90.64 | 91.05 | | 20 day SMA | 91.77 | 91.78 | 92.05 | | 35 day SMA | 96.78 | 97.46 | 98.28 | | 50 day SMA | 100.56 | 100.44 | 100.4 | | 100 day SMA | 94.34 | 94.29 | 94.27 | | 150 day SMA | 90.74 | 90.67 | 90.59 | | 200 day SMA | 87.3 | 87.2 | 87.13 |
|
|
