SpencerS SPENCERS full analysis,charts,indicators,moving averages,SMA,DMA,EMA,ADX,MACD,RSISpencer S SPENCERS WideScreen charts, DMA,SMA,EMA technical analysis, forecast prediction, by indicators ADX,MACD,RSI,CCI NSE stock exchange
Daily price and charts and targets SpencerS Strong Daily Stock price targets for SpencerS SPENCERS are 52.45 and 53.89 | Daily Target 1 | 51.36 | | Daily Target 2 | 52.1 | | Daily Target 3 | 52.8 | | Daily Target 4 | 53.54 | | Daily Target 5 | 54.24 |
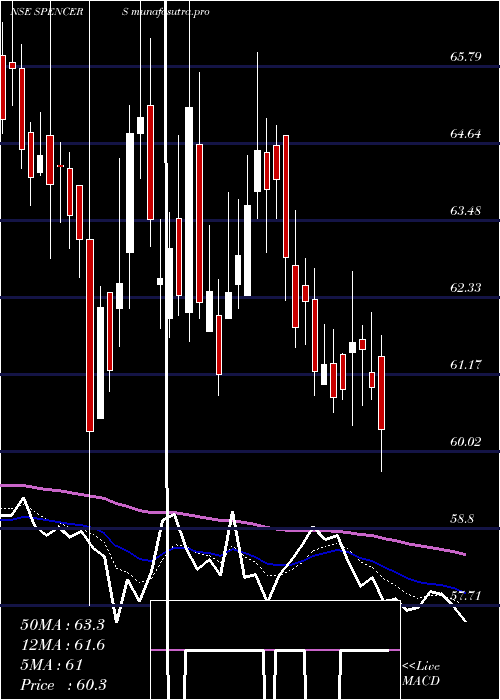
Daily price and volume Spencer S
| Date |
Closing |
Open |
Range |
Volume |
Wed 29 October 2025 |
52.84 (0.76%) |
52.44 |
52.06 - 53.50 |
0.506 times |
Tue 28 October 2025 |
52.44 (1.67%) |
51.61 |
51.61 - 54.10 |
1.5697 times |
Mon 27 October 2025 |
51.58 (1.18%) |
50.53 |
50.40 - 52.50 |
1.6304 times |
Fri 24 October 2025 |
50.98 (0.47%) |
50.99 |
50.74 - 51.67 |
0.6271 times |
Thu 23 October 2025 |
50.74 (-3.79%) |
53.48 |
50.51 - 53.48 |
2.1624 times |
Tue 21 October 2025 |
52.74 (2.13%) |
52.00 |
51.71 - 53.48 |
0.0826 times |
Mon 20 October 2025 |
51.64 (-2.46%) |
53.00 |
51.50 - 53.00 |
1.247 times |
Fri 17 October 2025 |
52.94 (-1.01%) |
53.48 |
52.40 - 54.00 |
0.9308 times |
Thu 16 October 2025 |
53.48 (-0.22%) |
53.60 |
52.95 - 54.79 |
0.8571 times |
Wed 15 October 2025 |
53.60 (-0.09%) |
54.13 |
53.40 - 54.16 |
0.3868 times |
Tue 14 October 2025 |
53.65 (-1.88%) |
55.45 |
53.50 - 55.45 |
0.3923 times |
Weekly price and charts SpencerS Strong weekly Stock price targets for SpencerS SPENCERS are 51.62 and 55.32 | Weekly Target 1 | 48.75 | | Weekly Target 2 | 50.79 | | Weekly Target 3 | 52.446666666667 | | Weekly Target 4 | 54.49 | | Weekly Target 5 | 56.15 |
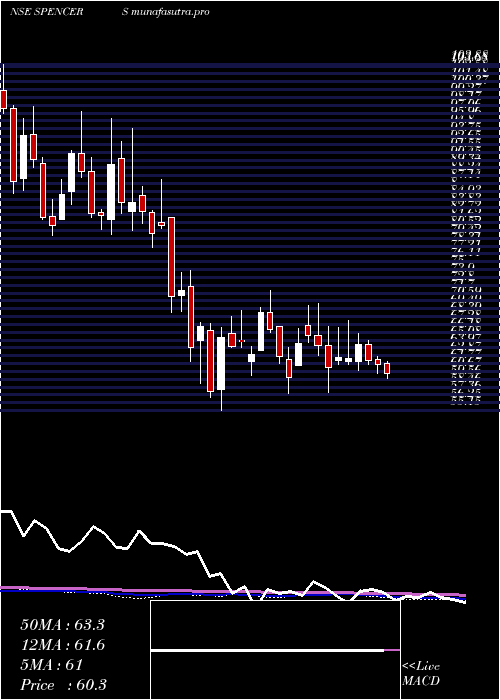
Weekly price and volumes for Spencer S
| Date |
Closing |
Open |
Range |
Volume |
Wed 29 October 2025 |
52.84 (3.65%) |
50.53 |
50.40 - 54.10 |
1.1181 times |
Fri 24 October 2025 |
50.98 (-3.7%) |
53.00 |
50.51 - 53.48 |
1.2427 times |
Fri 17 October 2025 |
52.94 (-5.23%) |
55.74 |
52.40 - 56.25 |
0.938 times |
Fri 10 October 2025 |
55.86 (-2.33%) |
57.20 |
54.99 - 61.40 |
1.5088 times |
Fri 03 October 2025 |
57.19 (5.99%) |
54.70 |
53.77 - 59.00 |
0.6375 times |
Fri 26 September 2025 |
53.96 (-5.13%) |
56.88 |
53.40 - 57.40 |
0.6431 times |
Fri 19 September 2025 |
56.88 (-0.54%) |
57.19 |
56.71 - 59.75 |
0.9688 times |
Fri 12 September 2025 |
57.19 (-2.24%) |
58.50 |
56.90 - 60.00 |
0.6991 times |
Fri 05 September 2025 |
58.50 (3.45%) |
56.16 |
55.06 - 64.00 |
1.7284 times |
Fri 29 August 2025 |
56.55 (-2.94%) |
58.89 |
56.00 - 60.48 |
0.5153 times |
Fri 22 August 2025 |
58.26 (4.5%) |
56.90 |
55.82 - 62.00 |
1.3221 times |
Monthly price and charts SpencerS Strong monthly Stock price targets for SpencerS SPENCERS are 46.12 and 57.12 | Monthly Target 1 | 43.88 | | Monthly Target 2 | 48.36 | | Monthly Target 3 | 54.88 | | Monthly Target 4 | 59.36 | | Monthly Target 5 | 65.88 |
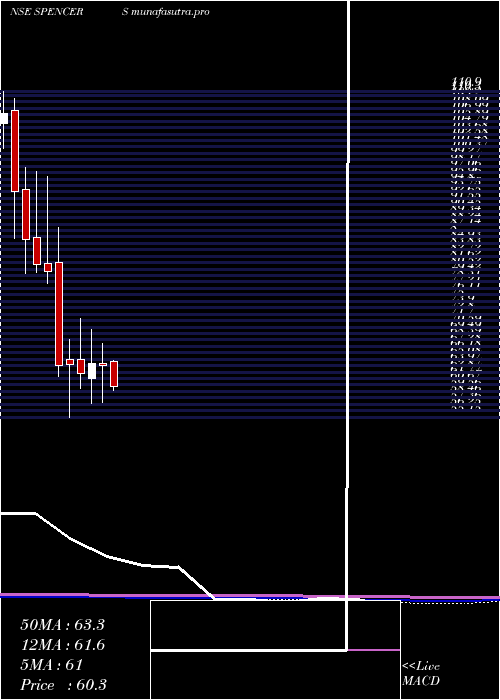
Monthly price and volumes Spencer S
| Date |
Closing |
Open |
Range |
Volume |
Wed 29 October 2025 |
52.84 (-5.17%) |
55.12 |
50.40 - 61.40 |
0.6531 times |
Tue 30 September 2025 |
55.72 (-1.47%) |
56.16 |
53.40 - 64.00 |
0.5476 times |
Fri 29 August 2025 |
56.55 (-3.02%) |
59.19 |
53.76 - 62.00 |
0.3896 times |
Thu 31 July 2025 |
58.31 (-8.82%) |
64.60 |
58.00 - 64.91 |
0.7246 times |
Mon 30 June 2025 |
63.95 (-0.51%) |
64.25 |
57.71 - 67.79 |
1.3532 times |
Fri 30 May 2025 |
64.28 (2.68%) |
61.80 |
57.55 - 70.19 |
0.937 times |
Wed 30 April 2025 |
62.60 (-2.45%) |
65.05 |
60.10 - 71.99 |
0.68 times |
Fri 28 March 2025 |
64.17 (0.16%) |
65.05 |
55.15 - 68.44 |
1.6843 times |
Fri 28 February 2025 |
64.07 (-20.04%) |
81.62 |
62.11 - 87.70 |
0.8889 times |
Fri 31 January 2025 |
80.13 (-1.39%) |
81.50 |
78.09 - 96.37 |
2.1416 times |
Tue 31 December 2024 |
81.26 (-5.04%) |
86.00 |
79.96 - 97.30 |
1.0189 times |
DMA SMA EMA moving averages of Spencer S SPENCERS
DMA (daily moving average) of Spencer S SPENCERS
| DMA period | DMA value | | 5 day DMA | 51.72 | | 12 day DMA | 52.61 | | 20 day DMA | 54.33 | | 35 day DMA | 55.44 | | 50 day DMA | 56.27 | | 100 day DMA | 58.57 | | 150 day DMA | 60.62 | | 200 day DMA | 64.2 | EMA (exponential moving average) of Spencer S SPENCERS
| EMA period | EMA current | EMA prev | EMA prev2 | | 5 day EMA | 52.26 | 51.97 | 51.73 | | 12 day EMA | 52.87 | 52.88 | 52.96 | | 20 day EMA | 53.69 | 53.78 | 53.92 | | 35 day EMA | 54.8 | 54.92 | 55.07 | | 50 day EMA | 55.79 | 55.91 | 56.05 |
SMA (simple moving average) of Spencer S SPENCERS
| SMA period | SMA current | SMA prev | SMA prev2 | | 5 day SMA | 51.72 | 51.7 | 51.54 | | 12 day SMA | 52.61 | 52.86 | 53.16 | | 20 day SMA | 54.33 | 54.44 | 54.52 | | 35 day SMA | 55.44 | 55.61 | 55.79 | | 50 day SMA | 56.27 | 56.33 | 56.42 | | 100 day SMA | 58.57 | 58.66 | 58.74 | | 150 day SMA | 60.62 | 60.7 | 60.75 | | 200 day SMA | 64.2 | 64.37 | 64.53 |
|
|
