Sonam SONAMLTD full analysis,charts,indicators,moving averages,SMA,DMA,EMA,ADX,MACD,RSISonam SONAMLTD WideScreen charts, DMA,SMA,EMA technical analysis, forecast prediction, by indicators ADX,MACD,RSI,CCI NSE stock exchange
Daily price and charts and targets Sonam Strong Daily Stock price targets for Sonam SONAMLTD are 41.08 and 42.44 | Daily Target 1 | 40 | | Daily Target 2 | 40.79 | | Daily Target 3 | 41.356666666667 | | Daily Target 4 | 42.15 | | Daily Target 5 | 42.72 |
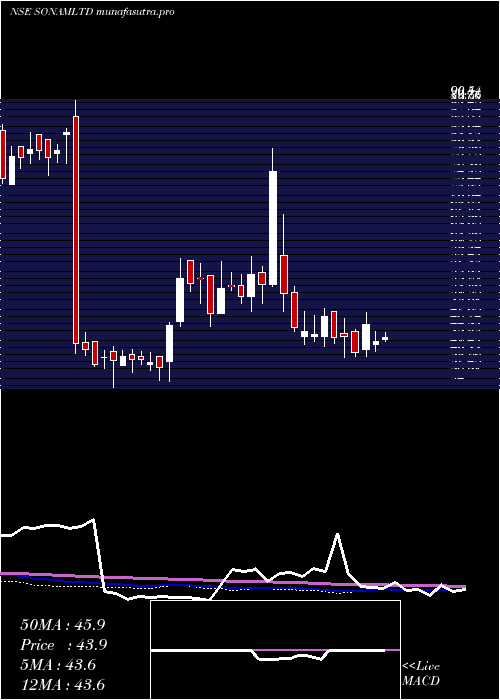
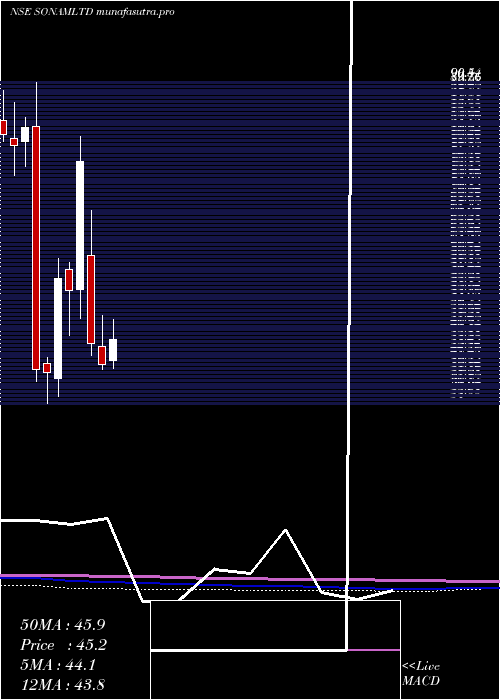
Daily price and volume Sonam
| Date |
Closing |
Open |
Range |
Volume |
Tue 28 October 2025 |
41.59 (0.97%) |
41.50 |
40.56 - 41.92 |
0.5483 times |
Mon 27 October 2025 |
41.19 (0.1%) |
42.16 |
40.36 - 42.16 |
0.5978 times |
Fri 24 October 2025 |
41.15 (-1.84%) |
42.00 |
41.00 - 42.00 |
0.1854 times |
Thu 23 October 2025 |
41.92 (-4.64%) |
44.00 |
41.31 - 44.89 |
1.4024 times |
Tue 21 October 2025 |
43.96 (12.57%) |
39.89 |
39.69 - 46.00 |
1.3611 times |
Mon 20 October 2025 |
39.05 (0.31%) |
39.90 |
38.10 - 39.90 |
0.3722 times |
Fri 17 October 2025 |
38.93 (1.33%) |
39.00 |
38.46 - 39.95 |
0.8623 times |
Thu 16 October 2025 |
38.42 (0.44%) |
38.30 |
37.49 - 39.41 |
1.8375 times |
Wed 15 October 2025 |
38.25 (-3.85%) |
39.97 |
38.00 - 40.49 |
1.9628 times |
Tue 14 October 2025 |
39.78 (-1.78%) |
41.88 |
39.50 - 41.88 |
0.8701 times |
Mon 13 October 2025 |
40.50 (-2.76%) |
43.80 |
40.20 - 43.80 |
0.6875 times |

Weekly price and charts Sonam Strong weekly Stock price targets for Sonam SONAMLTD are 40.08 and 41.88 | Weekly Target 1 | 39.57 | | Weekly Target 2 | 40.58 | | Weekly Target 3 | 41.37 | | Weekly Target 4 | 42.38 | | Weekly Target 5 | 43.17 |
Weekly price and volumes for Sonam
| Date |
Closing |
Open |
Range |
Volume |
Tue 28 October 2025 |
41.59 (1.07%) |
42.16 |
40.36 - 42.16 |
0.3009 times |
Fri 24 October 2025 |
41.15 (5.7%) |
39.90 |
38.10 - 46.00 |
0.8721 times |
Fri 17 October 2025 |
38.93 (-6.53%) |
43.80 |
37.49 - 43.80 |
1.6333 times |
Fri 10 October 2025 |
41.65 (-8.02%) |
44.40 |
40.01 - 45.12 |
0.9096 times |
Fri 03 October 2025 |
45.28 (3.71%) |
45.40 |
42.70 - 46.00 |
0.6488 times |
Fri 26 September 2025 |
43.66 (-6.03%) |
46.46 |
42.56 - 47.03 |
0.5539 times |
Fri 19 September 2025 |
46.46 (-5.47%) |
49.56 |
45.71 - 49.87 |
1.3659 times |
Fri 12 September 2025 |
49.15 (2.16%) |
48.35 |
48.25 - 50.43 |
0.9689 times |
Fri 05 September 2025 |
48.11 (-0.97%) |
48.10 |
48.00 - 50.93 |
1.4544 times |
Fri 29 August 2025 |
48.58 (-3.86%) |
51.35 |
48.10 - 51.93 |
1.2922 times |
Fri 22 August 2025 |
50.53 (5.53%) |
46.06 |
46.06 - 54.90 |
2.2993 times |
Monthly price and charts Sonam Strong monthly Stock price targets for Sonam SONAMLTD are 35.29 and 43.8 | Monthly Target 1 | 33.18 | | Monthly Target 2 | 37.39 | | Monthly Target 3 | 41.693333333333 | | Monthly Target 4 | 45.9 | | Monthly Target 5 | 50.2 |
Monthly price and volumes Sonam
| Date |
Closing |
Open |
Range |
Volume |
Tue 28 October 2025 |
41.59 (-5.99%) |
44.28 |
37.49 - 46.00 |
0.404 times |
Tue 30 September 2025 |
44.24 (-8.93%) |
48.10 |
42.56 - 50.93 |
0.4315 times |
Fri 29 August 2025 |
48.58 (2.14%) |
47.05 |
44.00 - 54.90 |
0.4731 times |
Thu 31 July 2025 |
47.56 (-4.23%) |
51.00 |
46.68 - 54.89 |
0.5437 times |
Mon 30 June 2025 |
49.66 (25.15%) |
39.68 |
38.50 - 54.00 |
0.8543 times |
Fri 30 May 2025 |
39.68 (1.69%) |
39.25 |
37.00 - 44.11 |
0.6584 times |
Wed 30 April 2025 |
39.02 (-4.34%) |
41.48 |
38.20 - 48.69 |
0.6603 times |
Fri 28 March 2025 |
40.79 (-8.3%) |
44.00 |
39.97 - 49.50 |
1.2406 times |
Fri 28 February 2025 |
44.48 (-41.86%) |
59.98 |
42.49 - 68.00 |
1.8107 times |
Thu 26 September 2024 |
76.50 (42.01%) |
54.01 |
49.00 - 80.95 |
2.9234 times |
Fri 30 August 2024 |
53.87 (-3.72%) |
57.55 |
46.00 - 58.78 |
1.2044 times |
DMA SMA EMA moving averages of Sonam SONAMLTD
DMA (daily moving average) of Sonam SONAMLTD
| DMA period | DMA value | | 5 day DMA | 41.96 | | 12 day DMA | 40.53 | | 20 day DMA | 41.9 | | 35 day DMA | 44.24 | | 50 day DMA | 45.82 | | 100 day DMA | 47.21 | | 150 day DMA | 45.37 | | 200 day DMA | 46.69 | EMA (exponential moving average) of Sonam SONAMLTD
| EMA period | EMA current | EMA prev | EMA prev2 | | 5 day EMA | 41.32 | 41.18 | 41.18 | | 12 day EMA | 41.38 | 41.34 | 41.37 | | 20 day EMA | 42.11 | 42.17 | 42.27 | | 35 day EMA | 43.64 | 43.76 | 43.91 | | 50 day EMA | 45.49 | 45.65 | 45.83 |
SMA (simple moving average) of Sonam SONAMLTD
| SMA period | SMA current | SMA prev | SMA prev2 | | 5 day SMA | 41.96 | 41.45 | 41 | | 12 day SMA | 40.53 | 40.52 | 40.69 | | 20 day SMA | 41.9 | 42 | 42.23 | | 35 day SMA | 44.24 | 44.43 | 44.66 | | 50 day SMA | 45.82 | 45.93 | 46.06 | | 100 day SMA | 47.21 | 47.25 | 47.29 | | 150 day SMA | 45.37 | 45.39 | 45.42 | | 200 day SMA | 46.69 | 46.75 | 46.81 |
|
|
