SolexEnergy SOLEX full analysis,charts,indicators,moving averages,SMA,DMA,EMA,ADX,MACD,RSISolex Energy SOLEX WideScreen charts, DMA,SMA,EMA technical analysis, forecast prediction, by indicators ADX,MACD,RSI,CCI NSE stock exchange
Daily price and charts and targets SolexEnergy Strong Daily Stock price targets for SolexEnergy SOLEX are 1452.88 and 1517.33 | Daily Target 1 | 1440.95 | | Daily Target 2 | 1464.8 | | Daily Target 3 | 1505.4 | | Daily Target 4 | 1529.25 | | Daily Target 5 | 1569.85 |
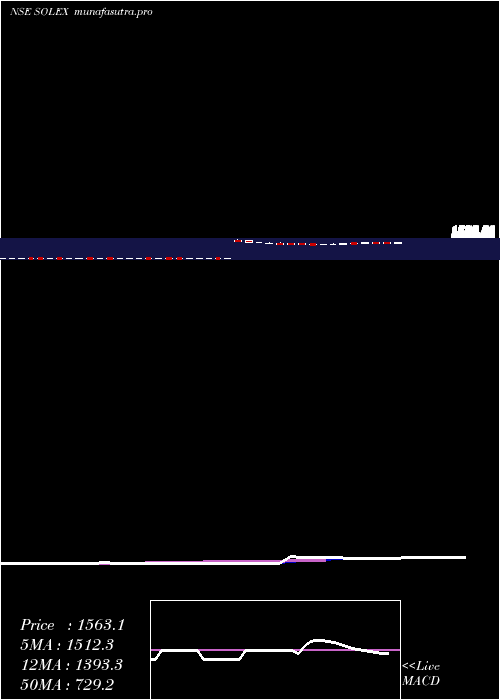
Daily price and volume Solex Energy
| Date |
Closing |
Open |
Range |
Volume |
Wed 29 October 2025 |
1488.65 (-1.53%) |
1546.00 |
1481.55 - 1546.00 |
0.9642 times |
Tue 28 October 2025 |
1511.85 (-1.83%) |
1540.20 |
1481.00 - 1590.00 |
0.9207 times |
Mon 27 October 2025 |
1540.00 (5%) |
1480.00 |
1475.85 - 1540.00 |
1.1351 times |
Fri 24 October 2025 |
1466.70 (-1.47%) |
1499.00 |
1460.00 - 1524.30 |
1.1515 times |
Thu 23 October 2025 |
1488.55 (5%) |
1417.75 |
1417.75 - 1488.55 |
1.0042 times |
Tue 21 October 2025 |
1417.70 (1.71%) |
1393.00 |
1393.00 - 1445.00 |
0.2816 times |
Mon 20 October 2025 |
1393.85 (0.01%) |
1386.70 |
1385.10 - 1404.00 |
0.4824 times |
Fri 17 October 2025 |
1393.65 (-0.95%) |
1440.00 |
1389.00 - 1440.00 |
0.7272 times |
Thu 16 October 2025 |
1407.05 (-0.92%) |
1448.90 |
1390.00 - 1454.70 |
2.3172 times |
Wed 15 October 2025 |
1420.10 (-1.13%) |
1464.90 |
1411.05 - 1464.90 |
1.016 times |
Tue 14 October 2025 |
1436.30 (-3.22%) |
1496.30 |
1415.10 - 1549.00 |
3.2475 times |
Weekly price and charts SolexEnergy Strong weekly Stock price targets for SolexEnergy SOLEX are 1482.25 and 1596.4 | Weekly Target 1 | 1404.02 | | Weekly Target 2 | 1446.33 | | Weekly Target 3 | 1518.1666666667 | | Weekly Target 4 | 1560.48 | | Weekly Target 5 | 1632.32 |
Weekly price and volumes for Solex Energy
| Date |
Closing |
Open |
Range |
Volume |
Wed 29 October 2025 |
1488.65 (1.5%) |
1480.00 |
1475.85 - 1590.00 |
0.6116 times |
Fri 24 October 2025 |
1466.70 (5.24%) |
1386.70 |
1385.10 - 1524.30 |
0.5913 times |
Fri 17 October 2025 |
1393.65 (-9.98%) |
1470.75 |
1389.00 - 1549.00 |
3.9024 times |
Fri 10 October 2025 |
1548.15 (3418.52%) |
42.10 |
42.10 - 1826.35 |
1.5787 times |
Fri 01 June 2018 |
44.00 (1.85%) |
44.70 |
41.00 - 45.10 |
0.1938 times |
Fri 25 May 2018 |
43.20 (-4.32%) |
45.00 |
42.10 - 46.55 |
0.4522 times |
Fri 18 May 2018 |
45.15 (-2.48%) |
46.25 |
45.05 - 48.50 |
0.2584 times |
Fri 11 May 2018 |
46.30 (1.76%) |
45.50 |
44.00 - 52.40 |
2.1101 times |
Fri 04 May 2018 |
45.50 (-3.19%) |
47.00 |
45.50 - 52.00 |
0.1938 times |
Fri 27 April 2018 |
47.00 (-2.69%) |
46.00 |
46.00 - 47.00 |
0.1077 times |
Wed 18 April 2018 |
48.30 (1.15%) |
48.50 |
48.00 - 48.50 |
0.2153 times |
Monthly price and charts SolexEnergy Strong monthly Stock price targets for SolexEnergy SOLEX are 1216.25 and 1657.5 | Monthly Target 1 | 1125.45 | | Monthly Target 2 | 1307.05 | | Monthly Target 3 | 1566.7 | | Monthly Target 4 | 1748.3 | | Monthly Target 5 | 2007.95 |
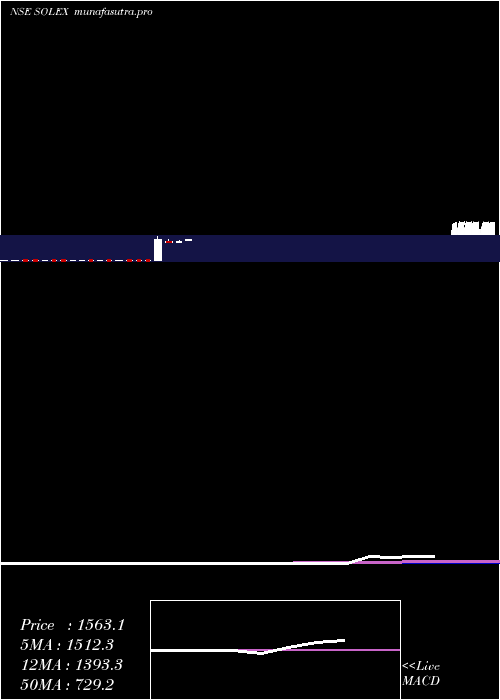
Monthly price and volumes Solex Energy
| Date |
Closing |
Open |
Range |
Volume |
Wed 29 October 2025 |
1488.65 (3435.99%) |
1760.00 |
1385.10 - 1826.35 |
1.5622 times |
Tue 05 June 2018 |
42.10 (2.68%) |
44.75 |
42.10 - 44.75 |
0.0151 times |
Wed 30 May 2018 |
41.00 (-10.87%) |
52.00 |
41.00 - 52.40 |
0.7321 times |
Mon 30 April 2018 |
46.00 (-2.13%) |
47.45 |
46.00 - 48.60 |
0.1262 times |
Wed 28 March 2018 |
47.00 (-2.59%) |
48.00 |
45.00 - 51.60 |
0.2878 times |
Tue 27 February 2018 |
48.25 (0%) |
43.50 |
42.00 - 52.20 |
3.2766 times |
Thu 30 October 2025 |
(0%) |
|
- |
0 times |

DMA SMA EMA moving averages of Solex Energy SOLEX
DMA (daily moving average) of Solex Energy SOLEX
| DMA period | DMA value | | 5 day DMA | 1499.15 | | 12 day DMA | 1454.04 | | 20 day DMA | 1127.94 | | 35 day DMA | 664.52 | | 50 day DMA | 479.32 | | 100 day DMA | | | 150 day DMA | | | 200 day DMA | | EMA (exponential moving average) of Solex Energy SOLEX
| EMA period | EMA current | EMA prev | EMA prev2 | | 5 day EMA | 1486.87 | 1485.98 | 1473.04 | | 12 day EMA | 1362.48 | 1339.55 | 1308.23 | | 20 day EMA | 1160.24 | 1125.69 | 1085.06 | | 35 day EMA | 873.65 | 837.44 | 797.74 | | 50 day EMA | 545.33 | 506.84 | 465.84 |
SMA (simple moving average) of Solex Energy SOLEX
| SMA period | SMA current | SMA prev | SMA prev2 | | 5 day SMA | 1499.15 | 1484.96 | 1461.36 | | 12 day SMA | 1454.04 | 1459 | 1468.81 | | 20 day SMA | 1127.94 | 1055.67 | 982.22 | | 35 day SMA | 664.52 | 623.3 | 581.45 | | 50 day SMA | 479.32 | 450.44 | 421.16 | | 100 day SMA | | 150 day SMA | | 200 day SMA |
|
|
