SmsLifesciences SMSLIFE full analysis,charts,indicators,moving averages,SMA,DMA,EMA,ADX,MACD,RSISms Lifesciences SMSLIFE WideScreen charts, DMA,SMA,EMA technical analysis, forecast prediction, by indicators ADX,MACD,RSI,CCI NSE stock exchange
Daily price and charts and targets SmsLifesciences Strong Daily Stock price targets for SmsLifesciences SMSLIFE are 1124.75 and 1171.25 | Daily Target 1 | 1089.5 | | Daily Target 2 | 1113.5 | | Daily Target 3 | 1136 | | Daily Target 4 | 1160 | | Daily Target 5 | 1182.5 |
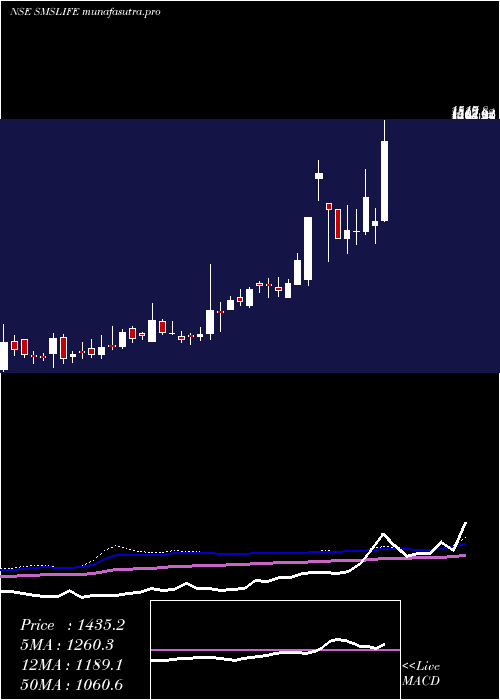
Daily price and volume Sms Lifesciences
| Date |
Closing |
Open |
Range |
Volume |
Tue 28 October 2025 |
1137.50 (1.6%) |
1124.60 |
1112.00 - 1158.50 |
1.4014 times |
Mon 27 October 2025 |
1119.60 (-0.25%) |
1110.20 |
1105.00 - 1140.30 |
3.0645 times |
Fri 24 October 2025 |
1122.40 (-1.6%) |
1148.50 |
1113.00 - 1148.50 |
0.8781 times |
Thu 23 October 2025 |
1140.60 (1.54%) |
1145.00 |
1115.00 - 1146.00 |
0.8853 times |
Tue 21 October 2025 |
1123.30 (0.04%) |
1115.60 |
1115.60 - 1138.30 |
0.1022 times |
Mon 20 October 2025 |
1122.80 (-0.37%) |
1125.80 |
1108.00 - 1146.40 |
0.7455 times |
Fri 17 October 2025 |
1127.00 (-0.62%) |
1132.30 |
1100.60 - 1148.80 |
1.5376 times |
Thu 16 October 2025 |
1134.00 (0.13%) |
1135.00 |
1115.00 - 1150.00 |
0.4498 times |
Wed 15 October 2025 |
1132.50 (-1.3%) |
1125.30 |
1112.60 - 1156.70 |
0.3226 times |
Tue 14 October 2025 |
1147.40 (1.95%) |
1143.00 |
1125.00 - 1150.00 |
0.6129 times |
Mon 13 October 2025 |
1125.40 (0.58%) |
1110.00 |
1110.00 - 1149.90 |
0.8082 times |

Weekly price and charts SmsLifesciences Strong weekly Stock price targets for SmsLifesciences SMSLIFE are 1121.25 and 1174.75 | Weekly Target 1 | 1080.17 | | Weekly Target 2 | 1108.83 | | Weekly Target 3 | 1133.6666666667 | | Weekly Target 4 | 1162.33 | | Weekly Target 5 | 1187.17 |
Weekly price and volumes for Sms Lifesciences
| Date |
Closing |
Open |
Range |
Volume |
Tue 28 October 2025 |
1137.50 (1.35%) |
1110.20 |
1105.00 - 1158.50 |
0.5797 times |
Fri 24 October 2025 |
1122.40 (-0.41%) |
1125.80 |
1108.00 - 1148.50 |
0.339 times |
Fri 17 October 2025 |
1127.00 (0.72%) |
1110.00 |
1100.60 - 1156.70 |
0.4844 times |
Fri 10 October 2025 |
1118.90 (-4.62%) |
1194.10 |
1105.40 - 1194.10 |
0.6249 times |
Fri 03 October 2025 |
1173.10 (2.08%) |
1178.90 |
1103.50 - 1211.10 |
0.7026 times |
Fri 26 September 2025 |
1149.20 (-2.98%) |
1196.50 |
1134.30 - 1259.90 |
2.09 times |
Fri 19 September 2025 |
1184.50 (-1.19%) |
1209.00 |
1175.00 - 1249.00 |
1.3796 times |
Fri 12 September 2025 |
1198.80 (7.86%) |
1100.00 |
1100.00 - 1250.00 |
1.9235 times |
Fri 05 September 2025 |
1111.40 (-1.76%) |
1169.00 |
1100.00 - 1169.00 |
0.7219 times |
Fri 29 August 2025 |
1131.30 (-1.65%) |
1135.00 |
1076.10 - 1187.90 |
1.1546 times |
Fri 22 August 2025 |
1150.30 (6.52%) |
1081.80 |
1070.00 - 1250.00 |
2.774 times |
Monthly price and charts SmsLifesciences Strong monthly Stock price targets for SmsLifesciences SMSLIFE are 1119.05 and 1229.55 | Monthly Target 1 | 1039.23 | | Monthly Target 2 | 1088.37 | | Monthly Target 3 | 1149.7333333333 | | Monthly Target 4 | 1198.87 | | Monthly Target 5 | 1260.23 |
Monthly price and volumes Sms Lifesciences
| Date |
Closing |
Open |
Range |
Volume |
Tue 28 October 2025 |
1137.50 (0.87%) |
1123.20 |
1100.60 - 1211.10 |
0.1203 times |
Tue 30 September 2025 |
1127.70 (-0.32%) |
1169.00 |
1100.00 - 1259.90 |
0.3389 times |
Fri 29 August 2025 |
1131.30 (-0.12%) |
1138.60 |
1067.00 - 1305.40 |
0.8113 times |
Thu 31 July 2025 |
1132.70 (-6.84%) |
1197.30 |
1080.00 - 1376.60 |
1.9222 times |
Mon 30 June 2025 |
1215.80 (-7.06%) |
1317.10 |
1082.90 - 1352.90 |
0.3834 times |
Fri 30 May 2025 |
1308.20 (-0.16%) |
1319.00 |
1175.00 - 1462.00 |
0.5086 times |
Wed 30 April 2025 |
1310.30 (21.55%) |
1077.00 |
1029.05 - 1680.00 |
1.2121 times |
Fri 28 March 2025 |
1078.00 (-17.62%) |
1190.00 |
959.80 - 1190.00 |
0.2913 times |
Tue 13 August 2024 |
1308.50 (37.72%) |
936.20 |
861.55 - 1359.90 |
3.4231 times |
Wed 31 July 2024 |
950.15 (12.37%) |
870.00 |
814.10 - 974.10 |
0.9888 times |
Fri 28 June 2024 |
845.55 (11.04%) |
761.00 |
681.05 - 855.55 |
0.8668 times |

DMA SMA EMA moving averages of Sms Lifesciences SMSLIFE
DMA (daily moving average) of Sms Lifesciences SMSLIFE
| DMA period | DMA value | | 5 day DMA | 1128.68 | | 12 day DMA | 1129.28 | | 20 day DMA | 1136.3 | | 35 day DMA | 1161.81 | | 50 day DMA | 1147.98 | | 100 day DMA | 1164.4 | | 150 day DMA | 1206 | | 200 day DMA | 1139.32 | EMA (exponential moving average) of Sms Lifesciences SMSLIFE
| EMA period | EMA current | EMA prev | EMA prev2 | | 5 day EMA | 1129.57 | 1125.61 | 1128.61 | | 12 day EMA | 1132.98 | 1132.16 | 1134.44 | | 20 day EMA | 1138.88 | 1139.02 | 1141.06 | | 35 day EMA | 1139.29 | 1139.4 | 1140.57 | | 50 day EMA | 1143.82 | 1144.08 | 1145.08 |
SMA (simple moving average) of Sms Lifesciences SMSLIFE
| SMA period | SMA current | SMA prev | SMA prev2 | | 5 day SMA | 1128.68 | 1125.74 | 1127.22 | | 12 day SMA | 1129.28 | 1129.54 | 1130.4 | | 20 day SMA | 1136.3 | 1136.88 | 1141.17 | | 35 day SMA | 1161.81 | 1161.06 | 1160.99 | | 50 day SMA | 1147.98 | 1146.93 | 1146.6 | | 100 day SMA | 1164.4 | 1166.12 | 1168.07 | | 150 day SMA | 1206 | 1205.87 | 1205.52 | | 200 day SMA | 1139.32 | 1137.62 | 1136.06 |
|
|
