SarthakMetals SMLT full analysis,charts,indicators,moving averages,SMA,DMA,EMA,ADX,MACD,RSISarthak Metals SMLT WideScreen charts, DMA,SMA,EMA technical analysis, forecast prediction, by indicators ADX,MACD,RSI,CCI NSE stock exchange
Daily price and charts and targets SarthakMetals Strong Daily Stock price targets for SarthakMetals SMLT are 98.3 and 103.8 | Daily Target 1 | 94.37 | | Daily Target 2 | 96.73 | | Daily Target 3 | 99.866666666667 | | Daily Target 4 | 102.23 | | Daily Target 5 | 105.37 |
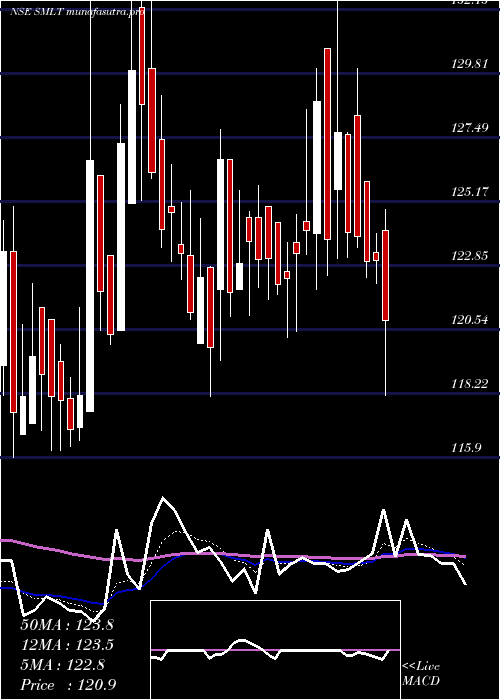
Daily price and volume Sarthak Metals
| Date |
Closing |
Open |
Range |
Volume |
Tue 28 October 2025 |
99.10 (1.02%) |
98.59 |
97.50 - 103.00 |
1.4025 times |
Mon 27 October 2025 |
98.10 (0.16%) |
100.59 |
97.04 - 100.59 |
0.7948 times |
Fri 24 October 2025 |
97.94 (-0.01%) |
100.90 |
96.07 - 100.90 |
0.8032 times |
Thu 23 October 2025 |
97.95 (-0.64%) |
99.00 |
97.17 - 101.95 |
1.0714 times |
Tue 21 October 2025 |
98.58 (1.37%) |
96.05 |
96.05 - 99.99 |
0.4732 times |
Mon 20 October 2025 |
97.25 (-1.13%) |
97.51 |
96.10 - 99.00 |
1.7966 times |
Fri 17 October 2025 |
98.36 (-1.1%) |
99.55 |
98.11 - 99.98 |
0.5986 times |
Thu 16 October 2025 |
99.45 (0.44%) |
100.00 |
98.81 - 103.94 |
1.3132 times |
Wed 15 October 2025 |
99.01 (-0.94%) |
102.89 |
98.15 - 102.90 |
0.871 times |
Tue 14 October 2025 |
99.95 (-0.56%) |
100.54 |
99.00 - 103.99 |
0.8755 times |
Mon 13 October 2025 |
100.51 (-1.66%) |
105.49 |
99.36 - 105.49 |
0.5329 times |
Weekly price and charts SarthakMetals Strong weekly Stock price targets for SarthakMetals SMLT are 95.09 and 101.05 | Weekly Target 1 | 93.75 | | Weekly Target 2 | 96.43 | | Weekly Target 3 | 99.713333333333 | | Weekly Target 4 | 102.39 | | Weekly Target 5 | 105.67 |
Weekly price and volumes for Sarthak Metals
| Date |
Closing |
Open |
Range |
Volume |
Tue 28 October 2025 |
99.10 (1.18%) |
100.59 |
97.04 - 103.00 |
0.4579 times |
Fri 24 October 2025 |
97.94 (-0.43%) |
97.51 |
96.05 - 101.95 |
0.8637 times |
Fri 17 October 2025 |
98.36 (-3.77%) |
105.49 |
98.11 - 105.49 |
0.8735 times |
Fri 10 October 2025 |
102.21 (-3.38%) |
105.79 |
98.50 - 109.00 |
0.9918 times |
Fri 03 October 2025 |
105.79 (0.21%) |
109.00 |
103.10 - 109.00 |
0.433 times |
Fri 26 September 2025 |
105.57 (-2.21%) |
110.85 |
103.15 - 116.00 |
0.8536 times |
Fri 19 September 2025 |
107.96 (-3.15%) |
111.30 |
104.01 - 113.01 |
1.0502 times |
Fri 12 September 2025 |
111.47 (5.85%) |
105.10 |
102.17 - 122.85 |
2.9147 times |
Fri 05 September 2025 |
105.31 (1.06%) |
105.95 |
103.22 - 107.39 |
0.378 times |
Fri 29 August 2025 |
104.21 (-2.64%) |
107.04 |
103.01 - 110.24 |
1.1837 times |
Fri 22 August 2025 |
107.04 (-0.93%) |
110.95 |
105.32 - 112.16 |
7.1286 times |

Monthly price and charts SarthakMetals Strong monthly Stock price targets for SarthakMetals SMLT are 91.1 and 104.05 | Monthly Target 1 | 88.43 | | Monthly Target 2 | 93.77 | | Monthly Target 3 | 101.38333333333 | | Monthly Target 4 | 106.72 | | Monthly Target 5 | 114.33 |
Monthly price and volumes Sarthak Metals
| Date |
Closing |
Open |
Range |
Volume |
Tue 28 October 2025 |
99.10 (-4.7%) |
104.00 |
96.05 - 109.00 |
0.3077 times |
Tue 30 September 2025 |
103.99 (-0.21%) |
105.95 |
102.17 - 122.85 |
0.4877 times |
Fri 29 August 2025 |
104.21 (-9.3%) |
114.55 |
98.85 - 124.59 |
0.9483 times |
Thu 31 July 2025 |
114.90 (-5.96%) |
122.63 |
113.62 - 133.99 |
0.5904 times |
Mon 30 June 2025 |
122.18 (4.52%) |
117.00 |
116.53 - 140.00 |
1.3257 times |
Fri 30 May 2025 |
116.90 (-6.42%) |
122.20 |
114.05 - 127.00 |
0.4553 times |
Wed 30 April 2025 |
124.92 (5.05%) |
129.00 |
102.50 - 134.30 |
3.2939 times |
Fri 28 March 2025 |
118.92 (-12.4%) |
140.45 |
97.50 - 146.25 |
1.0413 times |
Fri 28 February 2025 |
135.75 (-16.96%) |
167.11 |
130.60 - 167.11 |
0.3603 times |
Fri 31 January 2025 |
163.47 (4.05%) |
159.84 |
145.62 - 182.80 |
1.1893 times |
Tue 31 December 2024 |
157.10 (-0.02%) |
157.11 |
153.61 - 181.00 |
1.2867 times |

DMA SMA EMA moving averages of Sarthak Metals SMLT
DMA (daily moving average) of Sarthak Metals SMLT
| DMA period | DMA value | | 5 day DMA | 98.33 | | 12 day DMA | 99.03 | | 20 day DMA | 101.12 | | 35 day DMA | 103.98 | | 50 day DMA | 104.74 | | 100 day DMA | 112.8 | | 150 day DMA | 115.27 | | 200 day DMA | 123.23 | EMA (exponential moving average) of Sarthak Metals SMLT
| EMA period | EMA current | EMA prev | EMA prev2 | | 5 day EMA | 98.52 | 98.23 | 98.3 | | 12 day EMA | 99.46 | 99.52 | 99.78 | | 20 day EMA | 100.78 | 100.96 | 101.26 | | 35 day EMA | 102.41 | 102.6 | 102.86 | | 50 day EMA | 104.19 | 104.4 | 104.66 |
SMA (simple moving average) of Sarthak Metals SMLT
| SMA period | SMA current | SMA prev | SMA prev2 | | 5 day SMA | 98.33 | 97.96 | 98.02 | | 12 day SMA | 99.03 | 99.24 | 99.76 | | 20 day SMA | 101.12 | 101.44 | 101.8 | | 35 day SMA | 103.98 | 104.15 | 104.36 | | 50 day SMA | 104.74 | 104.89 | 105.02 | | 100 day SMA | 112.8 | 113.03 | 113.31 | | 150 day SMA | 115.27 | 115.42 | 115.55 | | 200 day SMA | 123.23 | 123.55 | 123.9 |
|
|
