SmcGlobal SMCGLOBAL full analysis,charts,indicators,moving averages,SMA,DMA,EMA,ADX,MACD,RSISmc Global SMCGLOBAL WideScreen charts, DMA,SMA,EMA technical analysis, forecast prediction, by indicators ADX,MACD,RSI,CCI NSE stock exchange
Daily price and charts and targets SmcGlobal Strong Daily Stock price targets for SmcGlobal SMCGLOBAL are 135.53 and 137.01 | Daily Target 1 | 134.37 | | Daily Target 2 | 135.2 | | Daily Target 3 | 135.84666666667 | | Daily Target 4 | 136.68 | | Daily Target 5 | 137.33 |
Daily price and volume Smc Global
| Date |
Closing |
Open |
Range |
Volume |
Tue 28 October 2025 |
136.04 (0.47%) |
136.00 |
135.01 - 136.49 |
1.1122 times |
Mon 27 October 2025 |
135.41 (-0.67%) |
135.00 |
134.30 - 136.77 |
1.4067 times |
Fri 24 October 2025 |
136.32 (0.45%) |
135.74 |
135.00 - 137.00 |
0.7168 times |
Thu 23 October 2025 |
135.71 (-0.29%) |
136.11 |
134.62 - 137.00 |
0.584 times |
Tue 21 October 2025 |
136.11 (0.61%) |
135.00 |
135.00 - 137.49 |
0.4939 times |
Mon 20 October 2025 |
135.29 (-0.22%) |
135.50 |
134.50 - 136.87 |
0.7527 times |
Fri 17 October 2025 |
135.59 (-0.1%) |
135.73 |
134.26 - 138.09 |
1.1164 times |
Thu 16 October 2025 |
135.73 (-0.46%) |
138.40 |
134.62 - 138.40 |
1.3045 times |
Wed 15 October 2025 |
136.36 (1.29%) |
134.62 |
134.04 - 137.00 |
0.9658 times |
Tue 14 October 2025 |
134.62 (-2.34%) |
138.90 |
133.38 - 138.90 |
1.5471 times |
Mon 13 October 2025 |
137.85 (-1.1%) |
140.00 |
137.00 - 140.45 |
1.3071 times |
Weekly price and charts SmcGlobal Strong weekly Stock price targets for SmcGlobal SMCGLOBAL are 135.17 and 137.64 | Weekly Target 1 | 133.23 | | Weekly Target 2 | 134.64 | | Weekly Target 3 | 135.70333333333 | | Weekly Target 4 | 137.11 | | Weekly Target 5 | 138.17 |
Weekly price and volumes for Smc Global
| Date |
Closing |
Open |
Range |
Volume |
Tue 28 October 2025 |
136.04 (-0.21%) |
135.00 |
134.30 - 136.77 |
0.2763 times |
Fri 24 October 2025 |
136.32 (0.54%) |
135.50 |
134.50 - 137.49 |
0.2795 times |
Fri 17 October 2025 |
135.59 (-2.73%) |
140.00 |
133.38 - 140.45 |
0.6846 times |
Fri 10 October 2025 |
139.39 (-0.52%) |
141.99 |
138.60 - 145.20 |
2.3127 times |
Fri 03 October 2025 |
140.12 (-0.1%) |
141.95 |
137.62 - 141.95 |
1.6817 times |
Fri 26 September 2025 |
140.26 (-0.72%) |
142.89 |
137.91 - 144.00 |
1.328 times |
Fri 19 September 2025 |
141.28 (2.72%) |
138.90 |
133.75 - 143.50 |
1.8739 times |
Fri 12 September 2025 |
137.54 (1.01%) |
136.17 |
132.91 - 143.56 |
0.7451 times |
Fri 05 September 2025 |
136.17 (4.64%) |
128.85 |
128.85 - 138.90 |
0.3413 times |
Fri 29 August 2025 |
130.13 (-4.03%) |
135.30 |
128.16 - 136.94 |
0.477 times |
Fri 22 August 2025 |
135.60 (-1.82%) |
140.00 |
134.42 - 140.00 |
0.6598 times |
Monthly price and charts SmcGlobal Strong monthly Stock price targets for SmcGlobal SMCGLOBAL are 128.8 and 140.62 | Monthly Target 1 | 126.39 | | Monthly Target 2 | 131.21 | | Monthly Target 3 | 138.20666666667 | | Monthly Target 4 | 143.03 | | Monthly Target 5 | 150.03 |
Monthly price and volumes Smc Global
| Date |
Closing |
Open |
Range |
Volume |
Tue 28 October 2025 |
136.04 (-2.67%) |
140.90 |
133.38 - 145.20 |
0.4458 times |
Tue 30 September 2025 |
139.77 (7.41%) |
128.85 |
128.85 - 144.00 |
0.6665 times |
Fri 29 August 2025 |
130.13 (-8.49%) |
141.28 |
128.16 - 148.80 |
0.2816 times |
Thu 31 July 2025 |
142.21 (-8.71%) |
159.00 |
137.76 - 160.00 |
1.2447 times |
Mon 30 June 2025 |
155.78 (32.64%) |
116.05 |
111.58 - 159.65 |
3.5448 times |
Fri 30 May 2025 |
117.45 (6.74%) |
110.03 |
101.50 - 124.00 |
0.8136 times |
Wed 30 April 2025 |
110.03 (5.55%) |
105.00 |
101.00 - 117.81 |
0.5082 times |
Fri 28 March 2025 |
104.24 (-8.94%) |
115.55 |
103.36 - 119.10 |
0.9467 times |
Fri 28 February 2025 |
114.47 (-9.62%) |
125.04 |
106.27 - 127.65 |
0.7589 times |
Fri 31 January 2025 |
126.66 (-6.43%) |
136.20 |
119.21 - 141.00 |
0.7891 times |
Tue 31 December 2024 |
135.37 (-11.44%) |
152.86 |
133.50 - 158.90 |
0.7794 times |
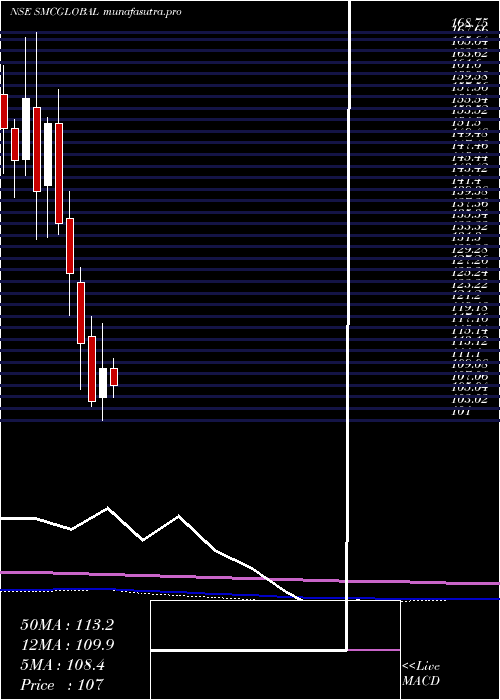
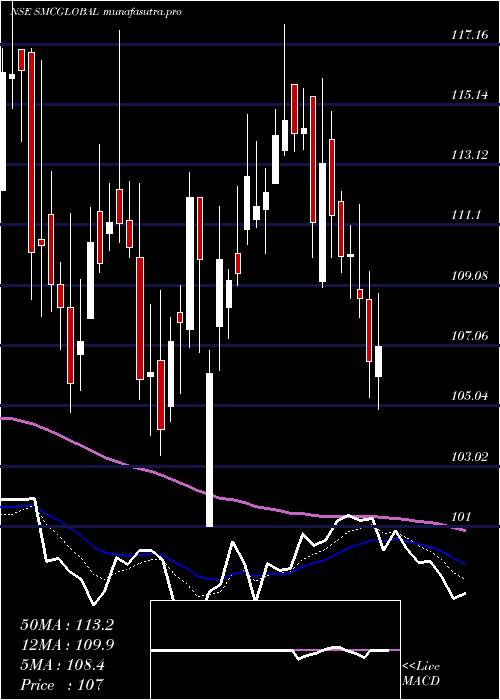
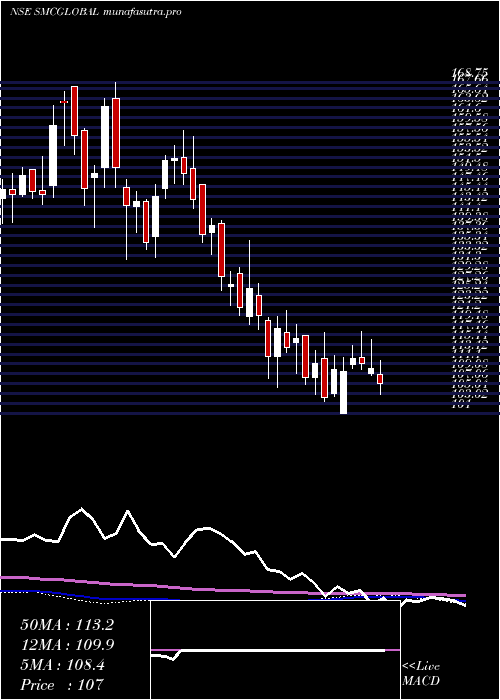
DMA SMA EMA moving averages of Smc Global SMCGLOBAL
DMA (daily moving average) of Smc Global SMCGLOBAL
| DMA period | DMA value | | 5 day DMA | 135.92 | | 12 day DMA | 136.2 | | 20 day DMA | 137.97 | | 35 day DMA | 138.34 | | 50 day DMA | 137.41 | | 100 day DMA | 141.18 | | 150 day DMA | 131.37 | | 200 day DMA | 128.44 | EMA (exponential moving average) of Smc Global SMCGLOBAL
| EMA period | EMA current | EMA prev | EMA prev2 | | 5 day EMA | 135.91 | 135.85 | 136.07 | | 12 day EMA | 136.57 | 136.67 | 136.9 | | 20 day EMA | 137.19 | 137.31 | 137.51 | | 35 day EMA | 137.33 | 137.41 | 137.53 | | 50 day EMA | 137.38 | 137.43 | 137.51 |
SMA (simple moving average) of Smc Global SMCGLOBAL
| SMA period | SMA current | SMA prev | SMA prev2 | | 5 day SMA | 135.92 | 135.77 | 135.8 | | 12 day SMA | 136.2 | 136.51 | 137.01 | | 20 day SMA | 137.97 | 138.18 | 138.46 | | 35 day SMA | 138.34 | 138.34 | 138.35 | | 50 day SMA | 137.41 | 137.49 | 137.53 | | 100 day SMA | 141.18 | 141.01 | 140.8 | | 150 day SMA | 131.37 | 131.2 | 131.01 | | 200 day SMA | 128.44 | 128.41 | 128.43 |
|
|
