SkipperInr1 SKIPPER full analysis,charts,indicators,moving averages,SMA,DMA,EMA,ADX,MACD,RSISkipper Inr1 SKIPPER WideScreen charts, DMA,SMA,EMA technical analysis, forecast prediction, by indicators ADX,MACD,RSI,CCI NSE stock exchange
operates under Construction & Engineering sector
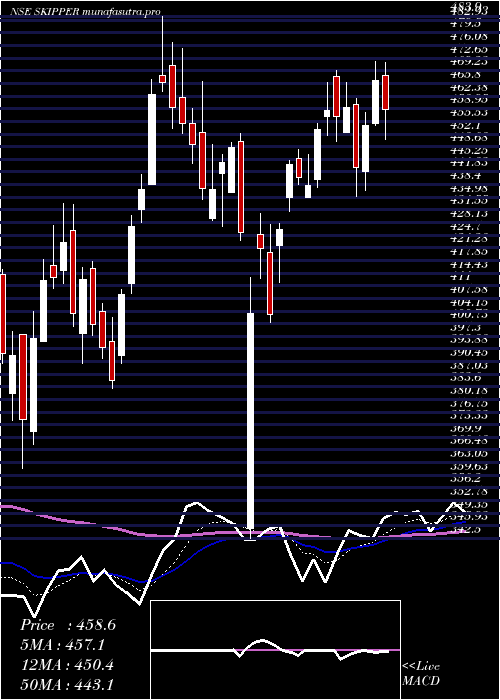
Daily price and charts and targets SkipperInr1 Strong Daily Stock price targets for SkipperInr1 SKIPPER are 506.03 and 518.43 | Daily Target 1 | 503.25 | | Daily Target 2 | 508.8 | | Daily Target 3 | 515.65 | | Daily Target 4 | 521.2 | | Daily Target 5 | 528.05 |
Daily price and volume Skipper Inr1
| Date |
Closing |
Open |
Range |
Volume |
Tue 28 October 2025 |
514.35 (-0.63%) |
519.00 |
510.10 - 522.50 |
0.5822 times |
Mon 27 October 2025 |
517.60 (-0.8%) |
521.75 |
514.25 - 524.00 |
0.6105 times |
Fri 24 October 2025 |
521.80 (-0.43%) |
524.80 |
519.65 - 527.50 |
0.5459 times |
Thu 23 October 2025 |
524.05 (2.73%) |
510.10 |
507.00 - 530.25 |
2.0709 times |
Tue 21 October 2025 |
510.10 (-0.11%) |
510.00 |
507.00 - 514.35 |
0.2803 times |
Mon 20 October 2025 |
510.65 (1.03%) |
508.80 |
498.70 - 515.20 |
1.1172 times |
Fri 17 October 2025 |
505.45 (-1.54%) |
511.00 |
495.70 - 513.00 |
1.7835 times |
Thu 16 October 2025 |
513.35 (0.27%) |
512.90 |
508.90 - 518.00 |
0.9144 times |
Wed 15 October 2025 |
511.95 (1.28%) |
507.40 |
505.25 - 514.80 |
0.8437 times |
Tue 14 October 2025 |
505.50 (-1.45%) |
514.90 |
477.85 - 517.60 |
1.2514 times |
Mon 13 October 2025 |
512.95 (-0.61%) |
515.00 |
508.25 - 517.80 |
0.8981 times |
Weekly price and charts SkipperInr1 Strong weekly Stock price targets for SkipperInr1 SKIPPER are 505.28 and 519.18 | Weekly Target 1 | 502.25 | | Weekly Target 2 | 508.3 | | Weekly Target 3 | 516.15 | | Weekly Target 4 | 522.2 | | Weekly Target 5 | 530.05 |
Weekly price and volumes for Skipper Inr1
| Date |
Closing |
Open |
Range |
Volume |
Tue 28 October 2025 |
514.35 (-1.43%) |
521.75 |
510.10 - 524.00 |
0.1739 times |
Fri 24 October 2025 |
521.80 (3.23%) |
508.80 |
498.70 - 530.25 |
0.5852 times |
Fri 17 October 2025 |
505.45 (-2.06%) |
515.00 |
477.85 - 518.00 |
0.8297 times |
Fri 10 October 2025 |
516.10 (-1.55%) |
526.90 |
505.10 - 528.00 |
0.6804 times |
Fri 03 October 2025 |
524.25 (2.52%) |
514.00 |
508.20 - 529.00 |
0.4904 times |
Fri 26 September 2025 |
511.35 (-4.47%) |
535.50 |
508.20 - 559.55 |
1.1698 times |
Fri 19 September 2025 |
535.30 (0.36%) |
534.45 |
526.00 - 550.00 |
0.9405 times |
Fri 12 September 2025 |
533.40 (-6.15%) |
573.70 |
530.00 - 588.00 |
1.6012 times |
Fri 05 September 2025 |
568.35 (10.8%) |
513.00 |
512.00 - 573.80 |
2.2598 times |
Fri 29 August 2025 |
512.95 (-4.97%) |
542.20 |
511.15 - 558.95 |
1.2692 times |
Fri 22 August 2025 |
539.80 (3.34%) |
529.80 |
522.90 - 561.00 |
2.1764 times |
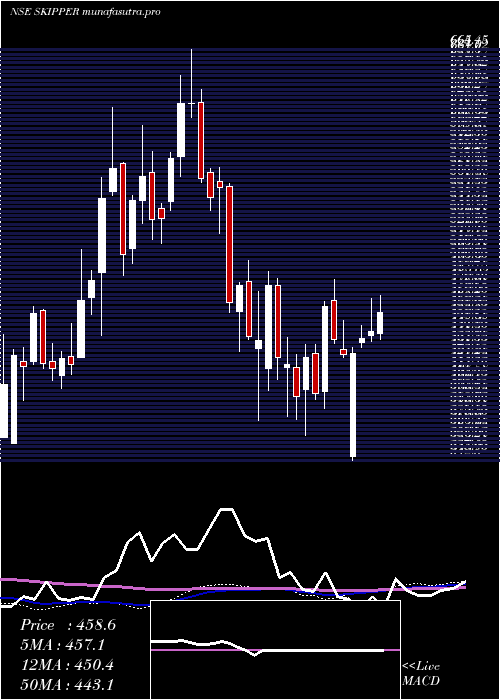
Monthly price and charts SkipperInr1 Strong monthly Stock price targets for SkipperInr1 SKIPPER are 469.9 and 522.3 | Monthly Target 1 | 455.08 | | Monthly Target 2 | 484.72 | | Monthly Target 3 | 507.48333333333 | | Monthly Target 4 | 537.12 | | Monthly Target 5 | 559.88 |
Monthly price and volumes Skipper Inr1
| Date |
Closing |
Open |
Range |
Volume |
Tue 28 October 2025 |
514.35 (-0.14%) |
514.80 |
477.85 - 530.25 |
0.3272 times |
Tue 30 September 2025 |
515.05 (0.41%) |
513.00 |
508.20 - 588.00 |
0.8252 times |
Fri 29 August 2025 |
512.95 (5.62%) |
496.45 |
491.30 - 564.70 |
2.5746 times |
Thu 31 July 2025 |
485.65 (-4.42%) |
509.90 |
446.60 - 514.80 |
0.5636 times |
Mon 30 June 2025 |
508.10 (3.36%) |
493.40 |
472.95 - 541.50 |
0.8984 times |
Fri 30 May 2025 |
491.60 (7.2%) |
470.00 |
425.00 - 519.00 |
1.1735 times |
Wed 30 April 2025 |
458.60 (4.88%) |
429.25 |
342.50 - 471.80 |
0.5034 times |
Fri 28 March 2025 |
437.25 (11.53%) |
397.80 |
361.55 - 483.90 |
0.8175 times |
Fri 28 February 2025 |
392.05 (-10.12%) |
414.50 |
374.50 - 490.40 |
0.8833 times |
Fri 31 January 2025 |
436.20 (-19.67%) |
544.55 |
373.10 - 571.90 |
1.4333 times |
Tue 31 December 2024 |
543.00 (-6.2%) |
581.00 |
520.60 - 665.00 |
1.8022 times |

DMA SMA EMA moving averages of Skipper Inr1 SKIPPER
DMA (daily moving average) of Skipper Inr1 SKIPPER
| DMA period | DMA value | | 5 day DMA | 517.58 | | 12 day DMA | 513.65 | | 20 day DMA | 515.11 | | 35 day DMA | 525.25 | | 50 day DMA | 529.22 | | 100 day DMA | 512.56 | | 150 day DMA | 495.41 | | 200 day DMA | 480.28 | EMA (exponential moving average) of Skipper Inr1 SKIPPER
| EMA period | EMA current | EMA prev | EMA prev2 | | 5 day EMA | 516.31 | 517.29 | 517.13 | | 12 day EMA | 515.9 | 516.18 | 515.92 | | 20 day EMA | 517.72 | 518.07 | 518.12 | | 35 day EMA | 521.41 | 521.83 | 522.08 | | 50 day EMA | 526.93 | 527.44 | 527.84 |
SMA (simple moving average) of Skipper Inr1 SKIPPER
| SMA period | SMA current | SMA prev | SMA prev2 | | 5 day SMA | 517.58 | 516.84 | 514.41 | | 12 day SMA | 513.65 | 513.28 | 513.05 | | 20 day SMA | 515.11 | 514.96 | 515.72 | | 35 day SMA | 525.25 | 526.8 | 527.72 | | 50 day SMA | 529.22 | 529.79 | 529.5 | | 100 day SMA | 512.56 | 512.37 | 512.1 | | 150 day SMA | 495.41 | 494.82 | 494.1 | | 200 day SMA | 480.28 | 480.29 | 480.49 |
|
|
