SjsEnterprises SJS full analysis,charts,indicators,moving averages,SMA,DMA,EMA,ADX,MACD,RSISjs Enterprises SJS WideScreen charts, DMA,SMA,EMA technical analysis, forecast prediction, by indicators ADX,MACD,RSI,CCI NSE stock exchange
Daily price and charts and targets SjsEnterprises Strong Daily Stock price targets for SjsEnterprises SJS are 1540.6 and 1617 | Daily Target 1 | 1480.27 | | Daily Target 2 | 1524.53 | | Daily Target 3 | 1556.6666666667 | | Daily Target 4 | 1600.93 | | Daily Target 5 | 1633.07 |
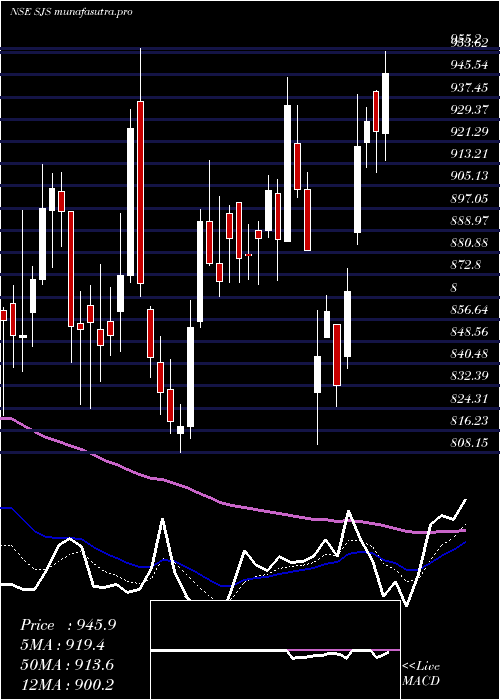
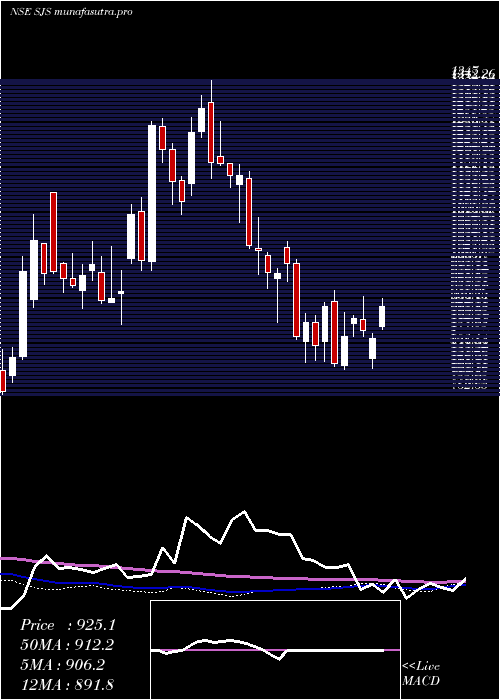
Daily price and volume Sjs Enterprises
| Date |
Closing |
Open |
Range |
Volume |
Wed 29 October 2025 |
1568.80 (2.87%) |
1532.30 |
1512.40 - 1588.80 |
2.4018 times |
Tue 28 October 2025 |
1525.00 (2.13%) |
1499.90 |
1488.20 - 1534.40 |
1.1018 times |
Mon 27 October 2025 |
1493.20 (-0.99%) |
1520.20 |
1474.30 - 1520.20 |
0.5453 times |
Fri 24 October 2025 |
1508.10 (-0.09%) |
1521.50 |
1500.00 - 1552.20 |
0.5766 times |
Thu 23 October 2025 |
1509.40 (-2.49%) |
1570.00 |
1502.00 - 1575.00 |
1.0693 times |
Tue 21 October 2025 |
1547.90 (1.17%) |
1537.40 |
1534.60 - 1564.00 |
0.2367 times |
Mon 20 October 2025 |
1530.00 (4.29%) |
1467.10 |
1447.10 - 1553.90 |
1.7521 times |
Fri 17 October 2025 |
1467.10 (-2.45%) |
1504.00 |
1455.50 - 1514.20 |
0.8491 times |
Thu 16 October 2025 |
1503.90 (-1.85%) |
1544.00 |
1497.00 - 1571.50 |
0.5992 times |
Wed 15 October 2025 |
1532.30 (0.15%) |
1531.50 |
1525.00 - 1563.70 |
0.8682 times |
Tue 14 October 2025 |
1530.00 (0.03%) |
1531.00 |
1516.70 - 1544.00 |
0.9911 times |
Weekly price and charts SjsEnterprises Strong weekly Stock price targets for SjsEnterprises SJS are 1521.55 and 1636.05 | Weekly Target 1 | 1429.47 | | Weekly Target 2 | 1499.13 | | Weekly Target 3 | 1543.9666666667 | | Weekly Target 4 | 1613.63 | | Weekly Target 5 | 1658.47 |
Weekly price and volumes for Sjs Enterprises
| Date |
Closing |
Open |
Range |
Volume |
Wed 29 October 2025 |
1568.80 (4.02%) |
1520.20 |
1474.30 - 1588.80 |
0.7388 times |
Fri 24 October 2025 |
1508.10 (2.79%) |
1467.10 |
1447.10 - 1575.00 |
0.6632 times |
Fri 17 October 2025 |
1467.10 (-2.62%) |
1506.60 |
1455.50 - 1571.50 |
0.6811 times |
Fri 10 October 2025 |
1506.60 (-1.3%) |
1535.00 |
1491.10 - 1577.50 |
0.8888 times |
Fri 03 October 2025 |
1526.50 (5.15%) |
1463.30 |
1418.10 - 1538.70 |
0.6061 times |
Fri 26 September 2025 |
1451.70 (-1.95%) |
1471.10 |
1445.10 - 1554.40 |
1.5229 times |
Fri 19 September 2025 |
1480.50 (5.73%) |
1409.80 |
1391.20 - 1508.90 |
1.2249 times |
Fri 12 September 2025 |
1400.30 (-0.16%) |
1417.70 |
1372.20 - 1448.40 |
0.6443 times |
Fri 05 September 2025 |
1402.60 (8.31%) |
1305.50 |
1293.00 - 1455.00 |
2.0164 times |
Fri 29 August 2025 |
1295.00 (-6.08%) |
1404.90 |
1285.90 - 1407.50 |
1.0136 times |
Fri 22 August 2025 |
1378.90 (17.21%) |
1200.00 |
1199.50 - 1394.50 |
3.5603 times |
Monthly price and charts SjsEnterprises Strong monthly Stock price targets for SjsEnterprises SJS are 1507.95 and 1649.65 | Monthly Target 1 | 1393.2 | | Monthly Target 2 | 1481 | | Monthly Target 3 | 1534.9 | | Monthly Target 4 | 1622.7 | | Monthly Target 5 | 1676.6 |
Monthly price and volumes Sjs Enterprises
| Date |
Closing |
Open |
Range |
Volume |
Wed 29 October 2025 |
1568.80 (8.01%) |
1463.60 |
1447.10 - 1588.80 |
0.7936 times |
Tue 30 September 2025 |
1452.40 (12.15%) |
1305.50 |
1293.00 - 1554.40 |
1.3976 times |
Fri 29 August 2025 |
1295.00 (5.52%) |
1229.90 |
1131.30 - 1407.50 |
1.3605 times |
Thu 31 July 2025 |
1227.20 (-4.36%) |
1295.00 |
1181.50 - 1316.20 |
0.9309 times |
Mon 30 June 2025 |
1283.10 (16.39%) |
1112.40 |
1080.90 - 1314.00 |
1.4789 times |
Fri 30 May 2025 |
1102.45 (18.61%) |
929.50 |
893.70 - 1133.00 |
1.2316 times |
Wed 30 April 2025 |
929.50 (2.89%) |
902.25 |
811.00 - 1021.05 |
0.6588 times |
Fri 28 March 2025 |
903.35 (5.92%) |
861.40 |
808.15 - 955.20 |
0.8159 times |
Fri 28 February 2025 |
852.90 (-13.66%) |
1036.00 |
821.65 - 1046.20 |
0.5098 times |
Fri 31 January 2025 |
987.85 (-14.4%) |
1154.00 |
896.45 - 1191.40 |
0.8223 times |
Tue 31 December 2024 |
1154.00 (-7.66%) |
1251.45 |
1128.25 - 1347.00 |
0.8043 times |

DMA SMA EMA moving averages of Sjs Enterprises SJS
DMA (daily moving average) of Sjs Enterprises SJS
| DMA period | DMA value | | 5 day DMA | 1520.9 | | 12 day DMA | 1520.43 | | 20 day DMA | 1515.15 | | 35 day DMA | 1489.35 | | 50 day DMA | 1447.33 | | 100 day DMA | 1336.96 | | 150 day DMA | 1219.22 | | 200 day DMA | 1148.19 | EMA (exponential moving average) of Sjs Enterprises SJS
| EMA period | EMA current | EMA prev | EMA prev2 | | 5 day EMA | 1531.9 | 1513.46 | 1507.69 | | 12 day EMA | 1520.17 | 1511.33 | 1508.85 | | 20 day EMA | 1507.43 | 1500.97 | 1498.44 | | 35 day EMA | 1470.84 | 1465.07 | 1461.54 | | 50 day EMA | 1433.09 | 1427.55 | 1423.57 |
SMA (simple moving average) of Sjs Enterprises SJS
| SMA period | SMA current | SMA prev | SMA prev2 | | 5 day SMA | 1520.9 | 1516.72 | 1517.72 | | 12 day SMA | 1520.43 | 1515.25 | 1513.33 | | 20 day SMA | 1515.15 | 1509.71 | 1506.05 | | 35 day SMA | 1489.35 | 1485.59 | 1482.09 | | 50 day SMA | 1447.33 | 1439.48 | 1432.99 | | 100 day SMA | 1336.96 | 1332.44 | 1328.21 | | 150 day SMA | 1219.22 | 1214.61 | 1210.39 | | 200 day SMA | 1148.19 | 1146.07 | 1144.02 |
|
|
