SJ SJLOGISTIC_SM full analysis,charts,indicators,moving averages,SMA,DMA,EMA,ADX,MACD,RSIS J SJLOGISTIC_SM WideScreen charts, DMA,SMA,EMA technical analysis, forecast prediction, by indicators ADX,MACD,RSI,CCI NSE stock exchange
Daily price and charts and targets SJ Strong Daily Stock price targets for SJ SJLOGISTIC_SM are 348.15 and 356.1 | Daily Target 1 | 346.45 | | Daily Target 2 | 349.85 | | Daily Target 3 | 354.4 | | Daily Target 4 | 357.8 | | Daily Target 5 | 362.35 |
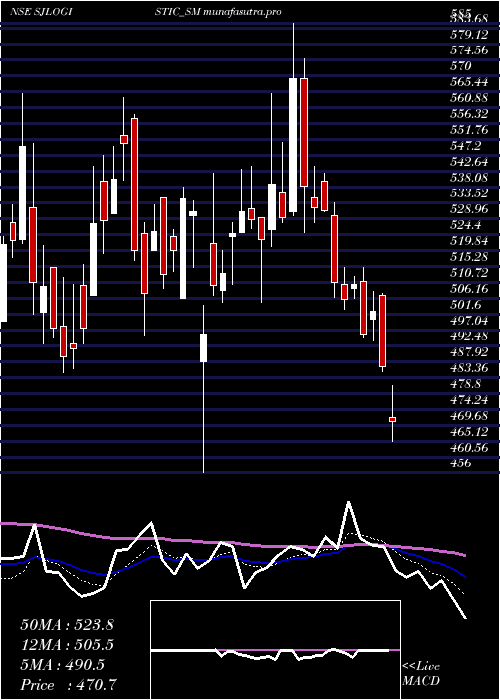
Daily price and volume S J
| Date |
Closing |
Open |
Range |
Volume |
Wed 29 October 2025 |
353.25 (0.7%) |
353.90 |
351.00 - 358.95 |
0.5951 times |
Tue 28 October 2025 |
350.80 (-0.69%) |
355.00 |
348.05 - 355.85 |
0.9218 times |
Mon 27 October 2025 |
353.25 (-0.86%) |
356.30 |
352.55 - 357.95 |
1.2719 times |
Fri 24 October 2025 |
356.30 (-0.39%) |
357.50 |
355.00 - 360.05 |
0.8985 times |
Thu 23 October 2025 |
357.70 (-1.05%) |
363.10 |
356.40 - 366.65 |
0.8401 times |
Tue 21 October 2025 |
361.50 (0.29%) |
362.25 |
360.10 - 364.95 |
0.5484 times |
Mon 20 October 2025 |
360.45 (1.04%) |
362.90 |
359.50 - 364.45 |
0.8285 times |
Fri 17 October 2025 |
356.75 (-1.67%) |
360.00 |
351.00 - 361.00 |
2.0887 times |
Thu 16 October 2025 |
362.80 (0.18%) |
361.00 |
361.00 - 366.90 |
0.9452 times |
Wed 15 October 2025 |
362.15 (-1.86%) |
366.15 |
358.00 - 366.60 |
1.0618 times |
Tue 14 October 2025 |
369.00 (-0.12%) |
373.95 |
362.30 - 373.95 |
0.6068 times |
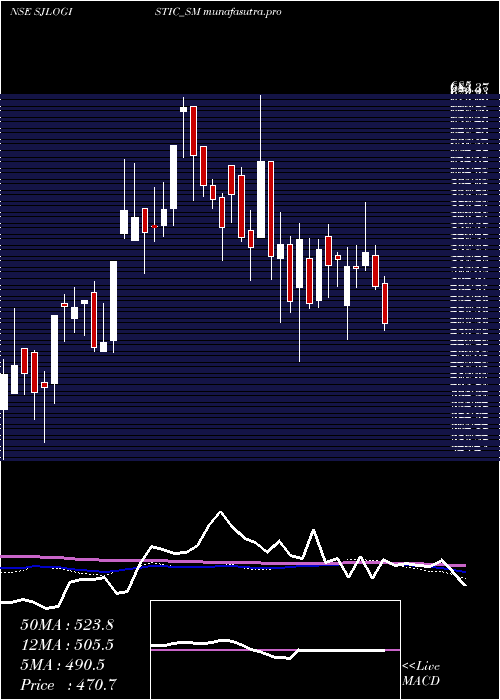
Weekly price and charts SJ Strong weekly Stock price targets for SJ SJLOGISTIC_SM are 345.2 and 356.1 | Weekly Target 1 | 342.52 | | Weekly Target 2 | 347.88 | | Weekly Target 3 | 353.41666666667 | | Weekly Target 4 | 358.78 | | Weekly Target 5 | 364.32 |
Weekly price and volumes for S J
| Date |
Closing |
Open |
Range |
Volume |
Wed 29 October 2025 |
353.25 (-0.86%) |
356.30 |
348.05 - 358.95 |
0.4282 times |
Fri 24 October 2025 |
356.30 (-0.13%) |
362.90 |
355.00 - 366.65 |
0.4784 times |
Fri 17 October 2025 |
356.75 (-4.66%) |
370.45 |
351.00 - 373.95 |
0.8601 times |
Fri 10 October 2025 |
374.20 (-1.07%) |
380.05 |
350.00 - 386.80 |
1.1503 times |
Fri 03 October 2025 |
378.25 (-3.46%) |
391.80 |
375.00 - 400.00 |
1.0392 times |
Fri 26 September 2025 |
391.80 (-10.45%) |
433.15 |
378.50 - 449.85 |
1.127 times |
Fri 19 September 2025 |
437.50 (2.9%) |
424.50 |
401.00 - 439.45 |
1.2955 times |
Fri 12 September 2025 |
425.15 (9.93%) |
386.75 |
380.50 - 437.85 |
1.7954 times |
Fri 05 September 2025 |
386.75 (-3.55%) |
401.10 |
385.00 - 405.45 |
0.8851 times |
Fri 29 August 2025 |
401.00 (-6.33%) |
426.00 |
380.10 - 429.00 |
0.9407 times |
Fri 22 August 2025 |
428.10 (16.57%) |
367.05 |
350.05 - 448.00 |
5.6047 times |
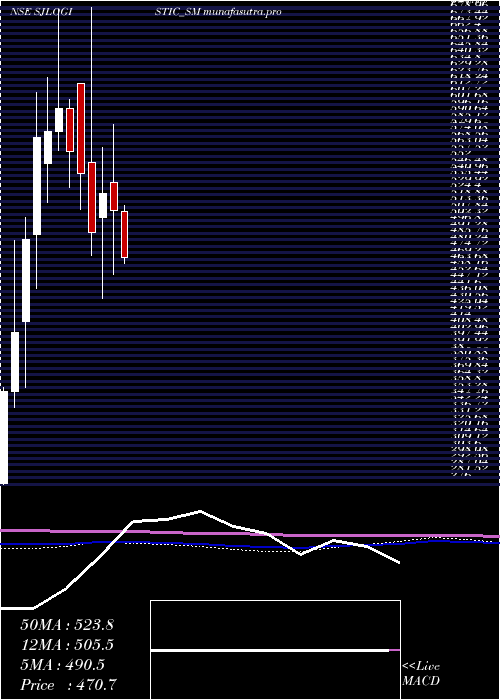
Monthly price and charts SJ Strong monthly Stock price targets for SJ SJLOGISTIC_SM are 329.18 and 372.13 | Monthly Target 1 | 321.15 | | Monthly Target 2 | 337.2 | | Monthly Target 3 | 364.1 | | Monthly Target 4 | 380.15 | | Monthly Target 5 | 407.05 |
Monthly price and volumes S J
| Date |
Closing |
Open |
Range |
Volume |
Wed 29 October 2025 |
353.25 (-8.33%) |
386.70 |
348.05 - 391.00 |
0.5829 times |
Tue 30 September 2025 |
385.35 (-3.9%) |
401.10 |
375.00 - 449.85 |
0.9998 times |
Fri 29 August 2025 |
401.00 (-0.75%) |
405.00 |
350.05 - 448.00 |
1.9946 times |
Thu 31 July 2025 |
404.05 (-12.41%) |
462.10 |
397.55 - 479.90 |
1.0793 times |
Mon 30 June 2025 |
461.30 (-6.6%) |
500.00 |
459.20 - 528.80 |
0.8671 times |
Fri 30 May 2025 |
493.90 (-3.31%) |
510.00 |
465.00 - 570.00 |
0.9641 times |
Wed 30 April 2025 |
510.80 (-2.78%) |
535.00 |
456.00 - 585.00 |
0.7259 times |
Fri 28 March 2025 |
525.40 (6.86%) |
505.05 |
435.00 - 565.00 |
0.8264 times |
Fri 28 February 2025 |
491.65 (-9.45%) |
552.05 |
472.10 - 685.00 |
1.2721 times |
Fri 31 January 2025 |
542.95 (-3.28%) |
619.90 |
511.90 - 619.90 |
0.6877 times |
Tue 08 October 2024 |
561.35 (-6.21%) |
598.50 |
530.70 - 606.00 |
0.2454 times |
DMA SMA EMA moving averages of S J SJLOGISTIC_SM
DMA (daily moving average) of S J SJLOGISTIC_SM
| DMA period | DMA value | | 5 day DMA | 354.26 | | 12 day DMA | 359.45 | | 20 day DMA | 364.82 | | 35 day DMA | 385.44 | | 50 day DMA | 391.18 | | 100 day DMA | 417.75 | | 150 day DMA | 452.26 | | 200 day DMA | 476.63 | EMA (exponential moving average) of S J SJLOGISTIC_SM
| EMA period | EMA current | EMA prev | EMA prev2 | | 5 day EMA | 354.42 | 355.01 | 357.12 | | 12 day EMA | 359.9 | 361.11 | 362.98 | | 20 day EMA | 366.91 | 368.35 | 370.2 | | 35 day EMA | 376.23 | 377.58 | 379.16 | | 50 day EMA | 387.6 | 389 | 390.56 |
SMA (simple moving average) of S J SJLOGISTIC_SM
| SMA period | SMA current | SMA prev | SMA prev2 | | 5 day SMA | 354.26 | 355.91 | 357.84 | | 12 day SMA | 359.45 | 361.2 | 361.75 | | 20 day SMA | 364.82 | 366.16 | 368.21 | | 35 day SMA | 385.44 | 386.43 | 387.46 | | 50 day SMA | 391.18 | 391.46 | 391.93 | | 100 day SMA | 417.75 | 419.29 | 421.04 | | 150 day SMA | 452.26 | 453.22 | 454.16 | | 200 day SMA | 476.63 | 477.85 | 479.1 |
|
|
