SintercomIndia SINTERCOM full analysis,charts,indicators,moving averages,SMA,DMA,EMA,ADX,MACD,RSISintercom India SINTERCOM WideScreen charts, DMA,SMA,EMA technical analysis, forecast prediction, by indicators ADX,MACD,RSI,CCI NSE stock exchange
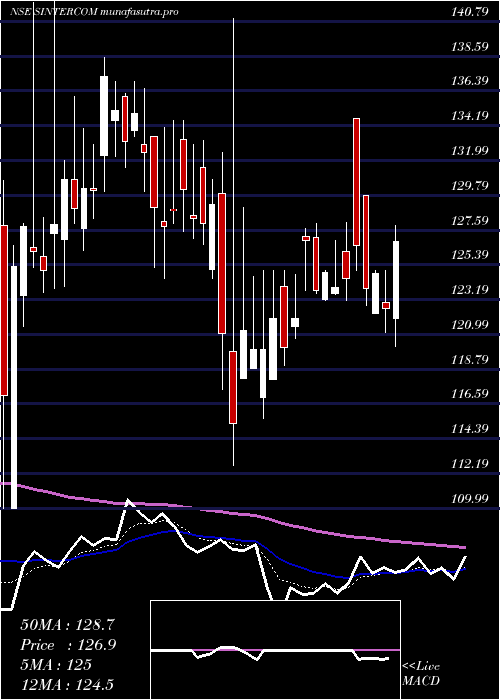
Daily price and charts and targets SintercomIndia Strong Daily Stock price targets for SintercomIndia SINTERCOM are 118.66 and 121.66 | Daily Target 1 | 116.44 | | Daily Target 2 | 117.88 | | Daily Target 3 | 119.44 | | Daily Target 4 | 120.88 | | Daily Target 5 | 122.44 |
Daily price and volume Sintercom India
| Date |
Closing |
Open |
Range |
Volume |
Tue 28 October 2025 |
119.32 (0.07%) |
119.00 |
118.00 - 121.00 |
0.0642 times |
Mon 27 October 2025 |
119.24 (-1.45%) |
120.79 |
119.00 - 123.87 |
0.3065 times |
Fri 24 October 2025 |
120.99 (0.82%) |
125.00 |
119.51 - 125.00 |
1.8667 times |
Thu 23 October 2025 |
120.00 (0.69%) |
120.01 |
120.00 - 122.10 |
0.0194 times |
Tue 21 October 2025 |
119.18 (0.12%) |
119.04 |
119.00 - 122.11 |
0.0177 times |
Mon 20 October 2025 |
119.04 (-0.95%) |
121.10 |
119.00 - 121.89 |
0.2462 times |
Fri 17 October 2025 |
120.18 (-0.77%) |
121.11 |
120.00 - 123.77 |
0.1328 times |
Thu 16 October 2025 |
121.11 (-1.38%) |
122.80 |
121.00 - 124.50 |
0.0507 times |
Wed 15 October 2025 |
122.80 (0.87%) |
122.64 |
122.03 - 126.00 |
3.0062 times |
Tue 14 October 2025 |
121.74 (0.48%) |
125.50 |
121.25 - 126.49 |
4.2897 times |
Mon 13 October 2025 |
121.16 (-2.12%) |
122.00 |
121.00 - 123.79 |
0.0087 times |
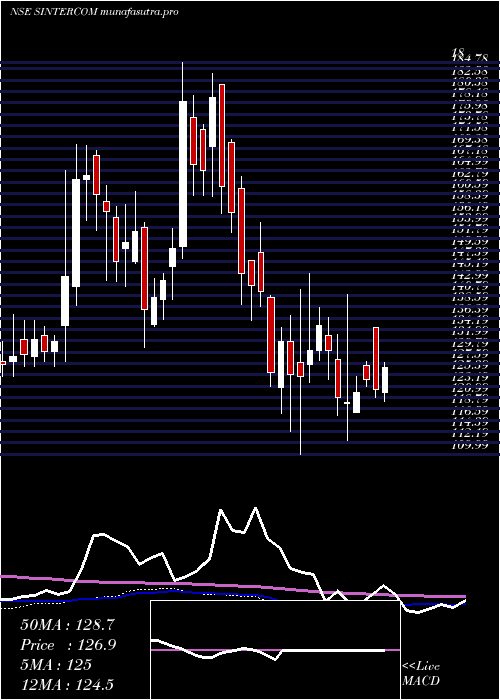
Weekly price and charts SintercomIndia Strong weekly Stock price targets for SintercomIndia SINTERCOM are 115.73 and 121.6 | Weekly Target 1 | 114.53 | | Weekly Target 2 | 116.92 | | Weekly Target 3 | 120.39666666667 | | Weekly Target 4 | 122.79 | | Weekly Target 5 | 126.27 |
Weekly price and volumes for Sintercom India
| Date |
Closing |
Open |
Range |
Volume |
Tue 28 October 2025 |
119.32 (-1.38%) |
120.79 |
118.00 - 123.87 |
0.1536 times |
Fri 24 October 2025 |
120.99 (0.67%) |
121.10 |
119.00 - 125.00 |
0.8906 times |
Fri 17 October 2025 |
120.18 (-2.92%) |
122.00 |
120.00 - 126.49 |
3.102 times |
Fri 10 October 2025 |
123.79 (0.02%) |
130.00 |
120.00 - 130.00 |
0.1593 times |
Fri 03 October 2025 |
123.76 (2.28%) |
121.10 |
120.00 - 124.99 |
0.0952 times |
Fri 26 September 2025 |
121.00 (-1.23%) |
123.49 |
121.00 - 125.00 |
0.6748 times |
Fri 19 September 2025 |
122.51 (1.42%) |
119.50 |
119.00 - 123.81 |
0.2725 times |
Fri 12 September 2025 |
120.80 (-0.98%) |
124.00 |
118.11 - 128.20 |
3.5552 times |
Fri 05 September 2025 |
122.00 (0%) |
123.61 |
121.00 - 126.03 |
0.9576 times |
Fri 29 August 2025 |
122.00 (-1.22%) |
126.00 |
122.00 - 128.09 |
0.1391 times |
Fri 22 August 2025 |
123.51 (-2.73%) |
126.68 |
123.00 - 127.00 |
0.5809 times |
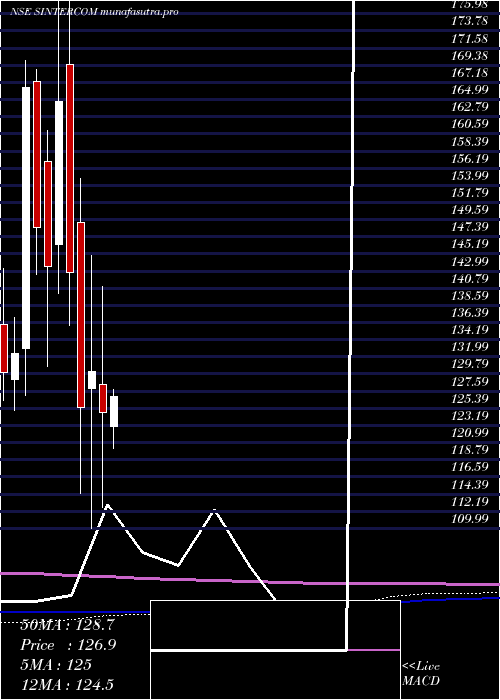
Monthly price and charts SintercomIndia Strong monthly Stock price targets for SintercomIndia SINTERCOM are 112.66 and 124.66 | Monthly Target 1 | 110.44 | | Monthly Target 2 | 114.88 | | Monthly Target 3 | 122.44 | | Monthly Target 4 | 126.88 | | Monthly Target 5 | 134.44 |
Monthly price and volumes Sintercom India
| Date |
Closing |
Open |
Range |
Volume |
Tue 28 October 2025 |
119.32 (-0.57%) |
121.10 |
118.00 - 130.00 |
0.6859 times |
Tue 30 September 2025 |
120.00 (-1.64%) |
123.61 |
118.11 - 128.20 |
0.8825 times |
Fri 29 August 2025 |
122.00 (-5.09%) |
130.00 |
122.00 - 135.19 |
0.3282 times |
Thu 31 July 2025 |
128.54 (1.3%) |
128.95 |
124.00 - 153.84 |
2.8001 times |
Mon 30 June 2025 |
126.89 (-1.8%) |
128.69 |
123.00 - 141.90 |
0.5587 times |
Fri 30 May 2025 |
129.22 (3.53%) |
123.02 |
120.19 - 137.00 |
0.3768 times |
Wed 30 April 2025 |
124.82 (-4.1%) |
128.49 |
112.69 - 140.99 |
0.8926 times |
Fri 28 March 2025 |
130.16 (3.73%) |
127.90 |
109.99 - 145.00 |
0.4948 times |
Fri 28 February 2025 |
125.48 (-12.14%) |
149.21 |
114.47 - 154.90 |
1.643 times |
Fri 31 January 2025 |
142.81 (-13.34%) |
169.51 |
136.00 - 183.85 |
1.3373 times |
Tue 31 December 2024 |
164.79 (14.73%) |
146.40 |
140.05 - 186.00 |
2.9322 times |
DMA SMA EMA moving averages of Sintercom India SINTERCOM
DMA (daily moving average) of Sintercom India SINTERCOM
| DMA period | DMA value | | 5 day DMA | 119.75 | | 12 day DMA | 120.71 | | 20 day DMA | 121.18 | | 35 day DMA | 121.22 | | 50 day DMA | 121.87 | | 100 day DMA | 125.6 | | 150 day DMA | 126.05 | | 200 day DMA | 129.26 | EMA (exponential moving average) of Sintercom India SINTERCOM
| EMA period | EMA current | EMA prev | EMA prev2 | | 5 day EMA | 119.77 | 120 | 120.38 | | 12 day EMA | 120.39 | 120.59 | 120.84 | | 20 day EMA | 120.84 | 121 | 121.18 | | 35 day EMA | 121.55 | 121.68 | 121.82 | | 50 day EMA | 122.05 | 122.16 | 122.28 |
SMA (simple moving average) of Sintercom India SINTERCOM
| SMA period | SMA current | SMA prev | SMA prev2 | | 5 day SMA | 119.75 | 119.69 | 119.88 | | 12 day SMA | 120.71 | 120.93 | 121.3 | | 20 day SMA | 121.18 | 121.26 | 121.37 | | 35 day SMA | 121.22 | 121.3 | 121.35 | | 50 day SMA | 121.87 | 121.95 | 122.07 | | 100 day SMA | 125.6 | 125.7 | 125.85 | | 150 day SMA | 126.05 | 126.16 | 126.28 | | 200 day SMA | 129.26 | 129.5 | 129.8 |
|
|
