SindhuTrade SINDHUTRAD full analysis,charts,indicators,moving averages,SMA,DMA,EMA,ADX,MACD,RSISindhu Trade SINDHUTRAD WideScreen charts, DMA,SMA,EMA technical analysis, forecast prediction, by indicators ADX,MACD,RSI,CCI NSE stock exchange
Daily price and charts and targets SindhuTrade Strong Daily Stock price targets for SindhuTrade SINDHUTRAD are 23.48 and 24.26 | Daily Target 1 | 23.34 | | Daily Target 2 | 23.62 | | Daily Target 3 | 24.123333333333 | | Daily Target 4 | 24.4 | | Daily Target 5 | 24.9 |
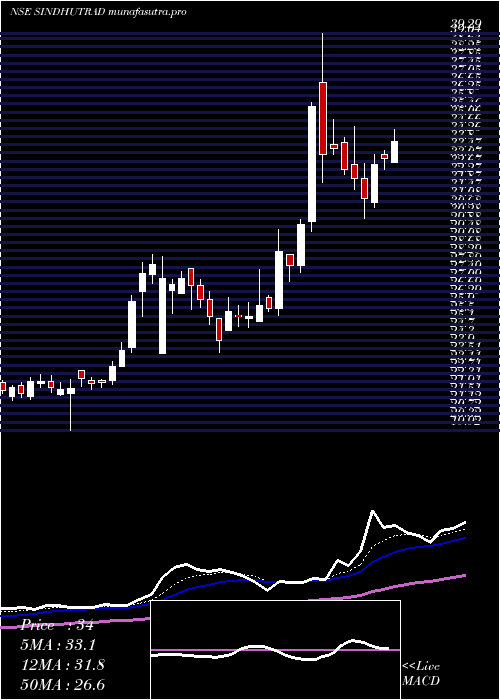
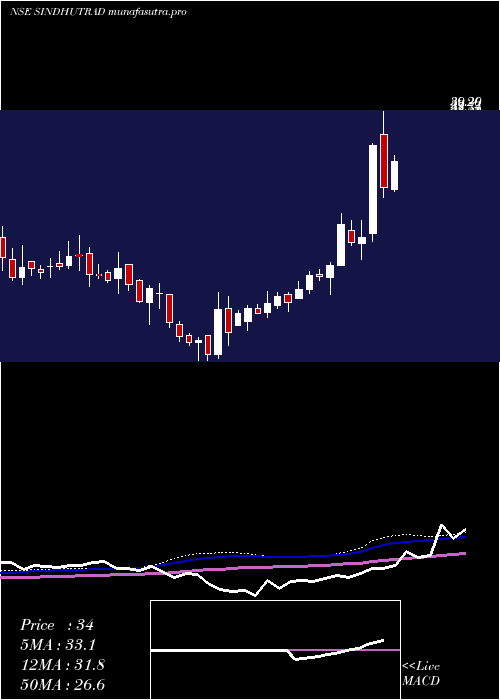
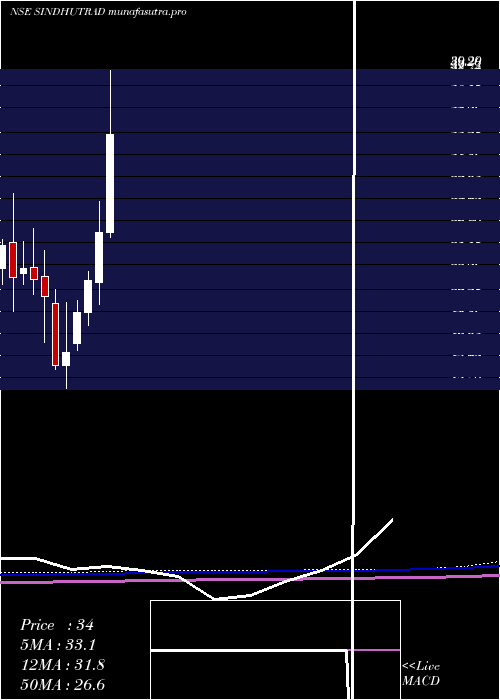
Daily price and volume Sindhu Trade
| Date |
Closing |
Open |
Range |
Volume |
Thu 30 October 2025 |
23.89 (-2.61%) |
24.63 |
23.85 - 24.63 |
1.3526 times |
Wed 29 October 2025 |
24.53 (2.25%) |
24.00 |
23.77 - 24.71 |
2.2972 times |
Tue 28 October 2025 |
23.99 (-1.6%) |
24.62 |
23.92 - 24.70 |
0.5173 times |
Mon 27 October 2025 |
24.38 (0.49%) |
24.31 |
24.23 - 24.60 |
0.3147 times |
Fri 24 October 2025 |
24.26 (-2.45%) |
25.11 |
24.13 - 25.11 |
0.6469 times |
Thu 23 October 2025 |
24.87 (-1.11%) |
25.15 |
24.55 - 25.49 |
0.6527 times |
Tue 21 October 2025 |
25.15 (-1.22%) |
25.50 |
24.66 - 25.77 |
0.24 times |
Mon 20 October 2025 |
25.46 (0.39%) |
25.45 |
24.91 - 26.00 |
0.9186 times |
Fri 17 October 2025 |
25.36 (0.83%) |
25.00 |
24.66 - 26.78 |
2.5675 times |
Thu 16 October 2025 |
25.15 (-0.4%) |
25.05 |
24.80 - 25.37 |
0.4925 times |
Wed 15 October 2025 |
25.25 (-0.63%) |
25.59 |
24.64 - 25.68 |
1.9673 times |
Weekly price and charts SindhuTrade Strong weekly Stock price targets for SindhuTrade SINDHUTRAD are 23.36 and 24.3 | Weekly Target 1 | 23.18 | | Weekly Target 2 | 23.54 | | Weekly Target 3 | 24.123333333333 | | Weekly Target 4 | 24.48 | | Weekly Target 5 | 25.06 |
Weekly price and volumes for Sindhu Trade
| Date |
Closing |
Open |
Range |
Volume |
Thu 30 October 2025 |
23.89 (-1.53%) |
24.31 |
23.77 - 24.71 |
0.3914 times |
Fri 24 October 2025 |
24.26 (-4.34%) |
25.45 |
24.13 - 26.00 |
0.2147 times |
Fri 17 October 2025 |
25.36 (-3.54%) |
26.15 |
24.64 - 26.78 |
0.5065 times |
Fri 10 October 2025 |
26.29 (-6.84%) |
28.21 |
26.03 - 28.66 |
0.3015 times |
Fri 03 October 2025 |
28.22 (4.56%) |
27.48 |
26.51 - 29.38 |
0.6573 times |
Fri 26 September 2025 |
26.99 (-9.49%) |
30.40 |
26.51 - 30.60 |
0.4404 times |
Fri 19 September 2025 |
29.82 (21.42%) |
24.56 |
24.17 - 32.74 |
6.392 times |
Fri 12 September 2025 |
24.56 (1.49%) |
24.44 |
23.73 - 25.98 |
0.4618 times |
Fri 05 September 2025 |
24.20 (3.15%) |
23.38 |
23.28 - 26.36 |
0.1811 times |
Fri 29 August 2025 |
23.46 (-1.64%) |
24.00 |
23.11 - 26.23 |
0.4531 times |
Fri 22 August 2025 |
23.85 (0.68%) |
24.20 |
23.70 - 24.87 |
0.1711 times |
Monthly price and charts SindhuTrade Strong monthly Stock price targets for SindhuTrade SINDHUTRAD are 21.23 and 26.44 | Monthly Target 1 | 20.34 | | Monthly Target 2 | 22.11 | | Monthly Target 3 | 25.546666666667 | | Monthly Target 4 | 27.32 | | Monthly Target 5 | 30.76 |
Monthly price and volumes Sindhu Trade
| Date |
Closing |
Open |
Range |
Volume |
Thu 30 October 2025 |
23.89 (-15.43%) |
28.00 |
23.77 - 28.98 |
0.4174 times |
Tue 30 September 2025 |
28.25 (20.42%) |
23.38 |
23.28 - 32.74 |
2.0682 times |
Fri 29 August 2025 |
23.46 (-14.35%) |
27.65 |
23.11 - 28.09 |
0.4865 times |
Thu 31 July 2025 |
27.39 (5.83%) |
25.89 |
25.53 - 39.29 |
2.9972 times |
Mon 30 June 2025 |
25.88 (18.07%) |
21.74 |
19.92 - 28.48 |
0.9495 times |
Fri 30 May 2025 |
21.92 (13.4%) |
19.31 |
18.21 - 22.66 |
0.7809 times |
Wed 30 April 2025 |
19.33 (20.89%) |
16.73 |
16.15 - 20.29 |
0.5335 times |
Fri 28 March 2025 |
15.99 (7.39%) |
14.89 |
13.00 - 20.16 |
0.5466 times |
Fri 28 February 2025 |
14.89 (-27.68%) |
20.05 |
14.60 - 21.18 |
0.3506 times |
Fri 31 January 2025 |
20.59 (-6.37%) |
22.30 |
16.80 - 24.45 |
0.8697 times |
Tue 31 December 2024 |
21.99 (-3.97%) |
22.98 |
20.76 - 26.21 |
0.4174 times |
DMA SMA EMA moving averages of Sindhu Trade SINDHUTRAD
DMA (daily moving average) of Sindhu Trade SINDHUTRAD
| DMA period | DMA value | | 5 day DMA | 24.21 | | 12 day DMA | 24.81 | | 20 day DMA | 25.71 | | 35 day DMA | 26.54 | | 50 day DMA | 25.87 | | 100 day DMA | 27.11 | | 150 day DMA | 24.66 | | 200 day DMA | 22.91 | EMA (exponential moving average) of Sindhu Trade SINDHUTRAD
| EMA period | EMA current | EMA prev | EMA prev2 | | 5 day EMA | 24.3 | 24.5 | 24.48 | | 12 day EMA | 24.87 | 25.05 | 25.14 | | 20 day EMA | 25.35 | 25.5 | 25.6 | | 35 day EMA | 25.45 | 25.54 | 25.6 | | 50 day EMA | 25.57 | 25.64 | 25.69 |
SMA (simple moving average) of Sindhu Trade SINDHUTRAD
| SMA period | SMA current | SMA prev | SMA prev2 | | 5 day SMA | 24.21 | 24.41 | 24.53 | | 12 day SMA | 24.81 | 24.99 | 25.14 | | 20 day SMA | 25.71 | 25.93 | 26.05 | | 35 day SMA | 26.54 | 26.57 | 26.56 | | 50 day SMA | 25.87 | 25.88 | 25.86 | | 100 day SMA | 27.11 | 27.1 | 27.08 | | 150 day SMA | 24.66 | 24.62 | 24.59 | | 200 day SMA | 22.91 | 22.91 | 22.9 |
|
|
