UtiamcSilveretf SILVERETF full analysis,charts,indicators,moving averages,SMA,DMA,EMA,ADX,MACD,RSIUtiamc Silveretf SILVERETF WideScreen charts, DMA,SMA,EMA technical analysis, forecast prediction, by indicators ADX,MACD,RSI,CCI NSE stock exchange
Daily price and charts and targets UtiamcSilveretf Strong Daily Stock price targets for UtiamcSilveretf SILVERETF are 138.62 and 146.45 | Daily Target 1 | 132.19 | | Daily Target 2 | 137.21 | | Daily Target 3 | 140.02 | | Daily Target 4 | 145.04 | | Daily Target 5 | 147.85 |
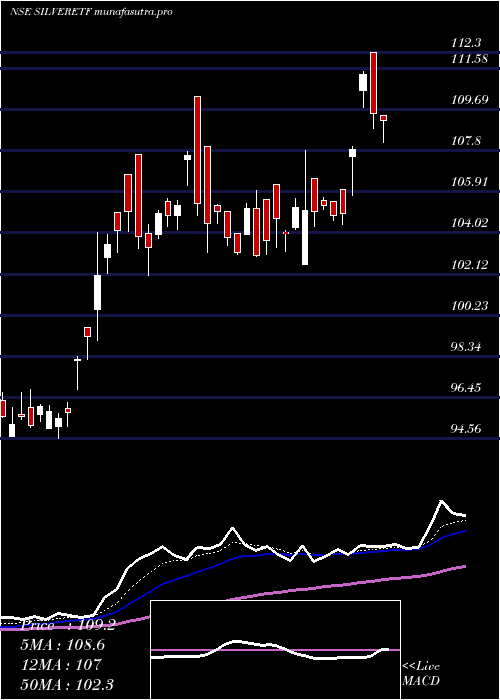
Daily price and volume Utiamc Silveretf
| Date |
Closing |
Open |
Range |
Volume |
Wed 29 October 2025 |
142.23 (5.36%) |
135.00 |
135.00 - 142.83 |
0.4816 times |
Tue 28 October 2025 |
135.00 (-3%) |
138.69 |
134.16 - 138.69 |
0.657 times |
Mon 27 October 2025 |
139.18 (0.12%) |
143.18 |
137.00 - 143.18 |
0.5276 times |
Fri 24 October 2025 |
139.01 (-2%) |
143.84 |
138.20 - 144.47 |
0.5887 times |
Thu 23 October 2025 |
141.85 (-3.83%) |
147.50 |
137.17 - 147.50 |
1.2903 times |
Tue 21 October 2025 |
147.50 (-1.63%) |
146.19 |
135.94 - 154.89 |
0.4194 times |
Mon 20 October 2025 |
149.94 (-7.43%) |
158.99 |
145.51 - 158.99 |
1.1771 times |
Fri 17 October 2025 |
161.98 (0.24%) |
162.62 |
161.00 - 166.00 |
1.1966 times |
Thu 16 October 2025 |
161.60 (-3.98%) |
168.01 |
157.00 - 174.42 |
1.8688 times |
Wed 15 October 2025 |
168.30 (-5.16%) |
181.94 |
165.00 - 186.00 |
1.793 times |
Tue 14 October 2025 |
177.46 (5.47%) |
168.26 |
168.26 - 187.04 |
3.1055 times |
Weekly price and charts UtiamcSilveretf Strong weekly Stock price targets for UtiamcSilveretf SILVERETF are 133.69 and 142.71 | Weekly Target 1 | 130.84 | | Weekly Target 2 | 136.53 | | Weekly Target 3 | 139.85666666667 | | Weekly Target 4 | 145.55 | | Weekly Target 5 | 148.88 |
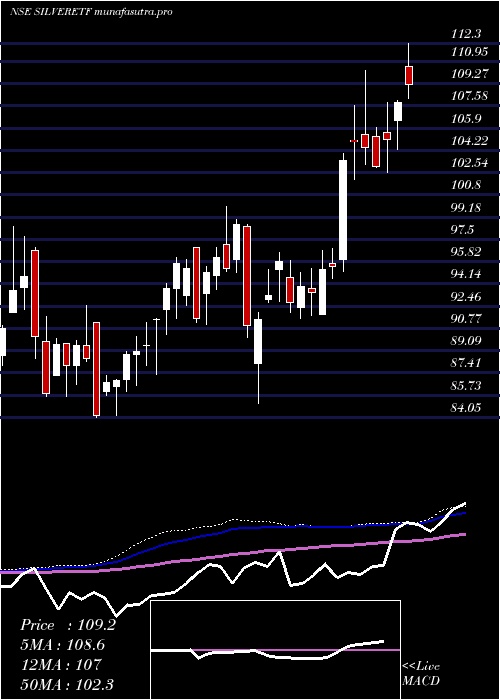
Weekly price and volumes for Utiamc Silveretf
| Date |
Closing |
Open |
Range |
Volume |
Wed 29 October 2025 |
142.23 (2.32%) |
143.18 |
134.16 - 143.18 |
0.5821 times |
Fri 24 October 2025 |
139.01 (-14.18%) |
158.99 |
135.94 - 158.99 |
1.2142 times |
Fri 17 October 2025 |
161.98 (2.89%) |
161.36 |
157.00 - 187.04 |
3.2751 times |
Fri 10 October 2025 |
157.43 (10.93%) |
144.00 |
143.10 - 169.55 |
1.7494 times |
Fri 03 October 2025 |
141.92 (4.61%) |
139.40 |
137.19 - 145.95 |
1.0414 times |
Fri 26 September 2025 |
135.66 (8.29%) |
128.50 |
128.12 - 136.99 |
0.6751 times |
Fri 19 September 2025 |
125.28 (0.1%) |
122.02 |
122.02 - 130.00 |
0.4941 times |
Fri 12 September 2025 |
125.15 (3.51%) |
123.93 |
119.83 - 125.84 |
0.4057 times |
Fri 05 September 2025 |
120.91 (5.08%) |
117.84 |
117.84 - 123.33 |
0.3423 times |
Fri 29 August 2025 |
115.06 (3.42%) |
114.03 |
112.26 - 116.58 |
0.2205 times |
Fri 22 August 2025 |
111.25 (-0.8%) |
111.21 |
107.80 - 114.17 |
0.2359 times |
Monthly price and charts UtiamcSilveretf Strong monthly Stock price targets for UtiamcSilveretf SILVERETF are 138.2 and 191.08 | Monthly Target 1 | 101.6 | | Monthly Target 2 | 121.91 | | Monthly Target 3 | 154.47666666667 | | Monthly Target 4 | 174.79 | | Monthly Target 5 | 207.36 |
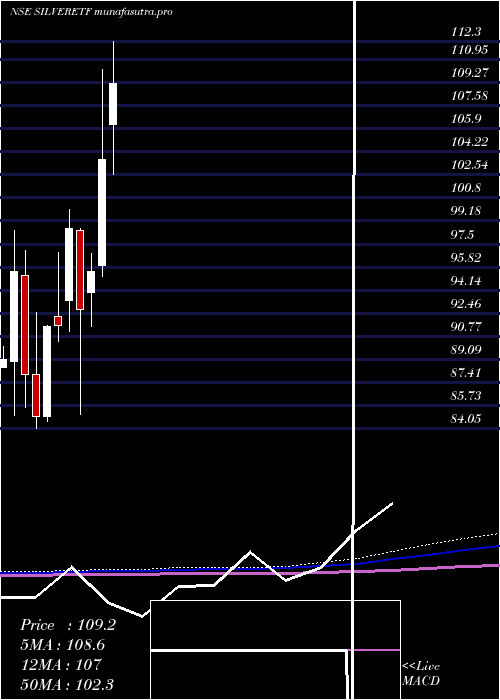
Monthly price and volumes Utiamc Silveretf
| Date |
Closing |
Open |
Range |
Volume |
Wed 29 October 2025 |
142.23 (2.55%) |
142.15 |
134.16 - 187.04 |
4.8487 times |
Tue 30 September 2025 |
138.69 (20.54%) |
117.84 |
117.84 - 144.34 |
1.6705 times |
Fri 29 August 2025 |
115.06 (6.31%) |
110.93 |
104.33 - 116.58 |
0.6021 times |
Thu 31 July 2025 |
108.23 (4.42%) |
106.24 |
102.55 - 113.60 |
0.6896 times |
Mon 30 June 2025 |
103.65 (8.55%) |
95.96 |
95.11 - 110.26 |
0.6366 times |
Fri 30 May 2025 |
95.49 (2.98%) |
94.00 |
91.51 - 96.80 |
0.3493 times |
Wed 30 April 2025 |
92.73 (-6%) |
98.50 |
85.08 - 98.62 |
0.5243 times |
Fri 28 March 2025 |
98.65 (7.78%) |
93.41 |
91.10 - 100.00 |
0.2033 times |
Fri 28 February 2025 |
91.53 (0.07%) |
92.18 |
90.36 - 96.90 |
0.2602 times |
Fri 31 January 2025 |
91.47 (7.69%) |
84.90 |
84.57 - 91.55 |
0.2155 times |
Tue 31 December 2024 |
84.94 (-3.44%) |
87.97 |
84.05 - 92.50 |
0.2379 times |
DMA SMA EMA moving averages of Utiamc Silveretf SILVERETF
DMA (daily moving average) of Utiamc Silveretf SILVERETF
| DMA period | DMA value | | 5 day DMA | 139.45 | | 12 day DMA | 152.69 | | 20 day DMA | 150.79 | | 35 day DMA | 140.99 | | 50 day DMA | 133.31 | | 100 day DMA | 120.45 | | 150 day DMA | 111.85 | | 200 day DMA | 107.02 | EMA (exponential moving average) of Utiamc Silveretf SILVERETF
| EMA period | EMA current | EMA prev | EMA prev2 | | 5 day EMA | 141.54 | 141.19 | 144.29 | | 12 day EMA | 146.11 | 146.81 | 148.96 | | 20 day EMA | 145.77 | 146.14 | 147.31 | | 35 day EMA | 140.44 | 140.33 | 140.64 | | 50 day EMA | 132.14 | 131.73 | 131.6 |
SMA (simple moving average) of Utiamc Silveretf SILVERETF
| SMA period | SMA current | SMA prev | SMA prev2 | | 5 day SMA | 139.45 | 140.51 | 143.5 | | 12 day SMA | 152.69 | 153.96 | 156.13 | | 20 day SMA | 150.79 | 150.72 | 150.76 | | 35 day SMA | 140.99 | 140.42 | 140.02 | | 50 day SMA | 133.31 | 132.71 | 132.26 | | 100 day SMA | 120.45 | 120.04 | 119.69 | | 150 day SMA | 111.85 | 111.55 | 111.3 | | 200 day SMA | 107.02 | 106.75 | 106.5 |
|
|
