SilkyOverseas SILKY_SM full analysis,charts,indicators,moving averages,SMA,DMA,EMA,ADX,MACD,RSISilky Overseas SILKY_SM WideScreen charts, DMA,SMA,EMA technical analysis, forecast prediction, by indicators ADX,MACD,RSI,CCI NSE stock exchange
Daily price and charts and targets SilkyOverseas Strong Daily Stock price targets for SilkyOverseas SILKY_SM are 138 and 138 | Daily Target 1 | 138 | | Daily Target 2 | 138 | | Daily Target 3 | 138 | | Daily Target 4 | 138 | | Daily Target 5 | 138 |
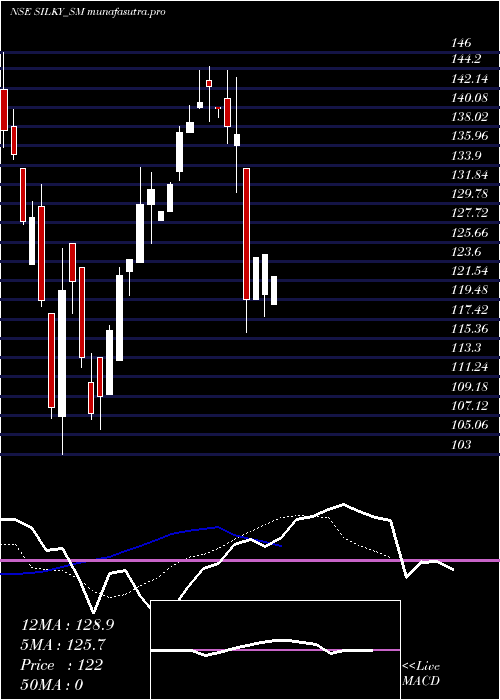
Daily price and volume Silky Overseas
| Date |
Closing |
Open |
Range |
Volume |
Wed 29 October 2025 |
138.00 (-1.43%) |
138.00 |
138.00 - 138.00 |
1.5707 times |
Tue 28 October 2025 |
140.00 (-1.06%) |
131.00 |
131.00 - 140.85 |
0.3665 times |
Fri 24 October 2025 |
141.50 (3.85%) |
136.00 |
136.00 - 141.50 |
0.1571 times |
Thu 23 October 2025 |
136.25 (-2.26%) |
139.25 |
136.00 - 145.00 |
0.3665 times |
Mon 20 October 2025 |
139.40 (3.34%) |
150.00 |
136.80 - 150.00 |
0.2618 times |
Fri 17 October 2025 |
134.90 (9.67%) |
124.50 |
123.00 - 144.00 |
2.6702 times |
Wed 15 October 2025 |
123.00 (0.82%) |
122.90 |
122.90 - 123.00 |
0.2618 times |
Mon 13 October 2025 |
122.00 (-0.81%) |
121.80 |
121.80 - 122.00 |
0.8901 times |
Thu 09 October 2025 |
123.00 (0.82%) |
123.00 |
123.00 - 123.00 |
1.4136 times |
Wed 08 October 2025 |
122.00 (-1.61%) |
122.00 |
120.00 - 122.00 |
2.0419 times |
Tue 07 October 2025 |
124.00 (6.9%) |
120.80 |
116.00 - 125.00 |
1.2565 times |
Weekly price and charts SilkyOverseas Strong weekly Stock price targets for SilkyOverseas SILKY_SM are 134.5 and 144.35 | Weekly Target 1 | 126.77 | | Weekly Target 2 | 132.38 | | Weekly Target 3 | 136.61666666667 | | Weekly Target 4 | 142.23 | | Weekly Target 5 | 146.47 |
Weekly price and volumes for Silky Overseas
| Date |
Closing |
Open |
Range |
Volume |
Wed 29 October 2025 |
138.00 (-2.47%) |
131.00 |
131.00 - 140.85 |
0.7008 times |
Fri 24 October 2025 |
141.50 (4.89%) |
150.00 |
136.00 - 150.00 |
0.2841 times |
Fri 17 October 2025 |
134.90 (9.67%) |
121.80 |
121.80 - 144.00 |
1.3826 times |
Thu 09 October 2025 |
123.00 (1.86%) |
116.00 |
116.00 - 125.00 |
3.1439 times |
Wed 01 October 2025 |
120.75 (5%) |
115.00 |
115.00 - 121.00 |
0.1515 times |
Fri 26 September 2025 |
115.00 (-2.38%) |
125.00 |
115.00 - 125.00 |
0.5303 times |
Fri 19 September 2025 |
117.80 (-3.44%) |
117.00 |
110.35 - 121.95 |
0.3977 times |
Thu 11 September 2025 |
122.00 (3.39%) |
116.60 |
112.05 - 122.80 |
1.6477 times |
Fri 05 September 2025 |
118.00 (-1.26%) |
119.50 |
117.00 - 124.30 |
0.5114 times |
Fri 29 August 2025 |
119.50 (-14.64%) |
141.00 |
115.95 - 144.00 |
1.25 times |
Fri 22 August 2025 |
140.00 (6.22%) |
133.25 |
132.25 - 144.50 |
3.4848 times |

Monthly price and charts SilkyOverseas Strong monthly Stock price targets for SilkyOverseas SILKY_SM are 127 and 161 | Monthly Target 1 | 100.67 | | Monthly Target 2 | 119.33 | | Monthly Target 3 | 134.66666666667 | | Monthly Target 4 | 153.33 | | Monthly Target 5 | 168.67 |
Monthly price and volumes Silky Overseas
| Date |
Closing |
Open |
Range |
Volume |
Wed 29 October 2025 |
138.00 (17.95%) |
120.70 |
116.00 - 150.00 |
0.629 times |
Tue 30 September 2025 |
117.00 (-2.09%) |
119.50 |
110.35 - 125.00 |
0.3561 times |
Fri 29 August 2025 |
119.50 (5.47%) |
110.70 |
105.60 - 144.50 |
1.4264 times |
Thu 31 July 2025 |
113.30 (0%) |
142.00 |
103.00 - 146.00 |
1.5885 times |
Wed 29 October 2025 |
(0%) |
|
- |
0 times |

DMA SMA EMA moving averages of Silky Overseas SILKY_SM
DMA (daily moving average) of Silky Overseas SILKY_SM
| DMA period | DMA value | | 5 day DMA | 139.03 | | 12 day DMA | 130 | | 20 day DMA | 125.7 | | 35 day DMA | 124.52 | | 50 day DMA | 125.05 | | 100 day DMA | | | 150 day DMA | | | 200 day DMA | | EMA (exponential moving average) of Silky Overseas SILKY_SM
| EMA period | EMA current | EMA prev | EMA prev2 | | 5 day EMA | 137.35 | 137.02 | 135.53 | | 12 day EMA | 132.17 | 131.11 | 129.5 | | 20 day EMA | 128.88 | 127.92 | 126.65 | | 35 day EMA | 126.87 | 126.21 | 125.4 | | 50 day EMA | 126.09 | 125.6 | 125.01 |
SMA (simple moving average) of Silky Overseas SILKY_SM
| SMA period | SMA current | SMA prev | SMA prev2 | | 5 day SMA | 139.03 | 138.41 | 135.01 | | 12 day SMA | 130 | 128.57 | 126.65 | | 20 day SMA | 125.7 | 124.47 | 123.37 | | 35 day SMA | 124.52 | 124.65 | 124.66 | | 50 day SMA | 125.05 | 124.7 | 124.05 | | 100 day SMA | | 150 day SMA | | 200 day SMA |
|
|
