SilInvestments SILINV full analysis,charts,indicators,moving averages,SMA,DMA,EMA,ADX,MACD,RSISil Investments SILINV WideScreen charts, DMA,SMA,EMA technical analysis, forecast prediction, by indicators ADX,MACD,RSI,CCI NSE stock exchange
operates under Textiles sector
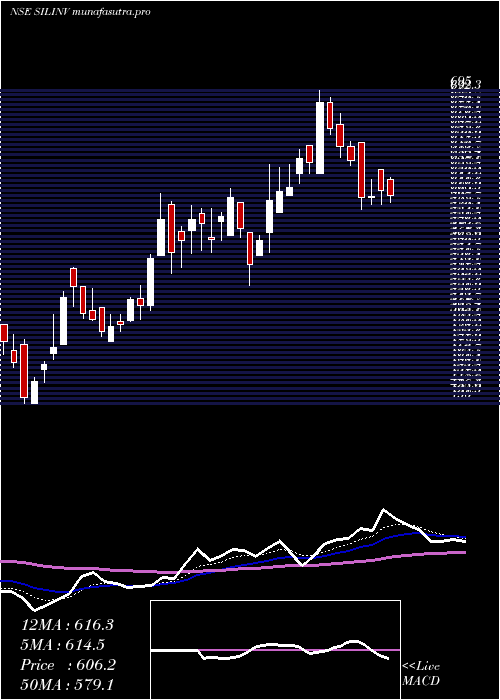
Daily price and charts and targets SilInvestments Strong Daily Stock price targets for SilInvestments SILINV are 704.38 and 751.23 | Daily Target 1 | 669.07 | | Daily Target 2 | 692.83 | | Daily Target 3 | 715.91666666667 | | Daily Target 4 | 739.68 | | Daily Target 5 | 762.77 |
Daily price and volume Sil Investments
| Date |
Closing |
Open |
Range |
Volume |
Tue 28 October 2025 |
716.60 (0.75%) |
711.25 |
692.15 - 739.00 |
0.3118 times |
Mon 27 October 2025 |
711.25 (1.77%) |
712.90 |
705.90 - 724.00 |
0.3675 times |
Fri 24 October 2025 |
698.90 (2.18%) |
690.50 |
682.55 - 708.00 |
0.2684 times |
Thu 23 October 2025 |
684.00 (-0.84%) |
698.70 |
675.25 - 729.00 |
0.9483 times |
Tue 21 October 2025 |
689.80 (2.7%) |
679.80 |
678.00 - 695.60 |
0.1919 times |
Mon 20 October 2025 |
671.65 (1.84%) |
666.40 |
666.40 - 687.50 |
0.8543 times |
Fri 17 October 2025 |
659.50 (2.75%) |
680.95 |
651.25 - 767.00 |
6.7528 times |
Thu 16 October 2025 |
641.85 (3.45%) |
635.00 |
627.00 - 649.00 |
0.1264 times |
Wed 15 October 2025 |
620.45 (1.46%) |
603.00 |
603.00 - 649.00 |
0.1445 times |
Tue 14 October 2025 |
611.55 (-0.88%) |
616.95 |
610.05 - 626.90 |
0.0341 times |
Mon 13 October 2025 |
616.95 (-2.74%) |
634.35 |
610.05 - 636.00 |
0.0451 times |
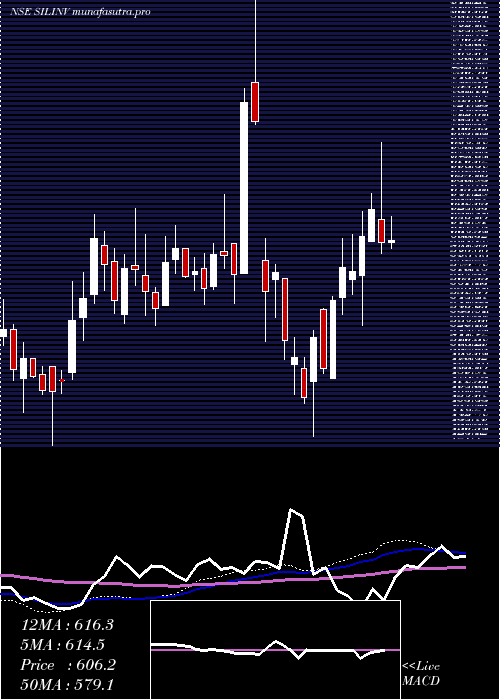
Weekly price and charts SilInvestments Strong weekly Stock price targets for SilInvestments SILINV are 704.38 and 751.23 | Weekly Target 1 | 669.07 | | Weekly Target 2 | 692.83 | | Weekly Target 3 | 715.91666666667 | | Weekly Target 4 | 739.68 | | Weekly Target 5 | 762.77 |
Weekly price and volumes for Sil Investments
| Date |
Closing |
Open |
Range |
Volume |
Tue 28 October 2025 |
716.60 (2.53%) |
712.90 |
692.15 - 739.00 |
0.5763 times |
Fri 24 October 2025 |
698.90 (5.97%) |
666.40 |
666.40 - 729.00 |
1.9201 times |
Fri 17 October 2025 |
659.50 (3.96%) |
634.35 |
603.00 - 767.00 |
6.0266 times |
Fri 10 October 2025 |
634.35 (-0.5%) |
647.40 |
621.25 - 647.40 |
0.35 times |
Fri 03 October 2025 |
637.55 (6.46%) |
607.80 |
601.00 - 644.90 |
0.2642 times |
Fri 26 September 2025 |
598.85 (1.38%) |
582.10 |
580.60 - 630.00 |
0.3874 times |
Fri 19 September 2025 |
590.70 (1.47%) |
584.00 |
577.05 - 597.40 |
0.1104 times |
Fri 12 September 2025 |
582.15 (-0.75%) |
596.95 |
580.10 - 600.00 |
0.1186 times |
Fri 05 September 2025 |
586.55 (5.23%) |
551.00 |
545.00 - 606.60 |
0.1703 times |
Fri 29 August 2025 |
557.40 (-3.3%) |
584.45 |
555.00 - 585.00 |
0.0762 times |
Fri 22 August 2025 |
576.40 (2.34%) |
576.00 |
529.95 - 588.00 |
0.2859 times |
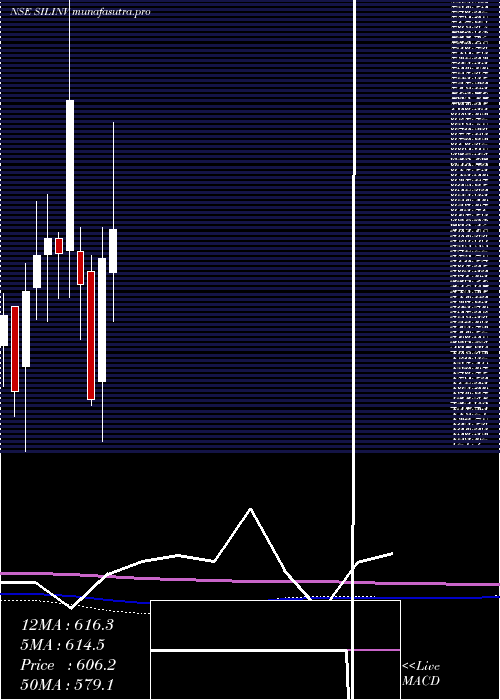
Monthly price and charts SilInvestments Strong monthly Stock price targets for SilInvestments SILINV are 659.8 and 823.8 | Monthly Target 1 | 531.53 | | Monthly Target 2 | 624.07 | | Monthly Target 3 | 695.53333333333 | | Monthly Target 4 | 788.07 | | Monthly Target 5 | 859.53 |
Monthly price and volumes Sil Investments
| Date |
Closing |
Open |
Range |
Volume |
Tue 28 October 2025 |
716.60 (16.95%) |
612.75 |
603.00 - 767.00 |
4.4384 times |
Tue 30 September 2025 |
612.75 (9.93%) |
551.00 |
545.00 - 630.00 |
0.4102 times |
Fri 29 August 2025 |
557.40 (-5.33%) |
580.15 |
529.95 - 600.00 |
0.5591 times |
Thu 31 July 2025 |
588.80 (-3.06%) |
614.40 |
575.00 - 620.00 |
0.3294 times |
Mon 30 June 2025 |
607.40 (-0.64%) |
607.50 |
581.00 - 625.40 |
0.5234 times |
Fri 30 May 2025 |
611.30 (0.85%) |
600.00 |
565.00 - 643.45 |
0.6455 times |
Wed 30 April 2025 |
606.15 (4.08%) |
571.00 |
530.00 - 695.00 |
1.0873 times |
Fri 28 March 2025 |
582.40 (25.29%) |
479.75 |
430.00 - 608.05 |
1.0364 times |
Fri 28 February 2025 |
464.85 (-17.03%) |
571.10 |
459.90 - 585.00 |
0.7905 times |
Fri 31 January 2025 |
560.25 (-21.5%) |
588.40 |
515.10 - 608.00 |
0.1797 times |
Wed 23 October 2024 |
713.70 (21.75%) |
589.30 |
550.10 - 910.00 |
11.4014 times |
DMA SMA EMA moving averages of Sil Investments SILINV
DMA (daily moving average) of Sil Investments SILINV
| DMA period | DMA value | | 5 day DMA | 700.11 | | 12 day DMA | 663.07 | | 20 day DMA | 647.7 | | 35 day DMA | 623.62 | | 50 day DMA | 607.22 | | 100 day DMA | 601.55 | | 150 day DMA | 603.44 | | 200 day DMA | 590.35 | EMA (exponential moving average) of Sil Investments SILINV
| EMA period | EMA current | EMA prev | EMA prev2 | | 5 day EMA | 698.97 | 690.16 | 679.62 | | 12 day EMA | 673.5 | 665.67 | 657.39 | | 20 day EMA | 655.23 | 648.77 | 642.2 | | 35 day EMA | 632.56 | 627.61 | 622.69 | | 50 day EMA | 613.29 | 609.07 | 604.9 |
SMA (simple moving average) of Sil Investments SILINV
| SMA period | SMA current | SMA prev | SMA prev2 | | 5 day SMA | 700.11 | 691.12 | 680.77 | | 12 day SMA | 663.07 | 656.13 | 649.82 | | 20 day SMA | 647.7 | 641.82 | 636.98 | | 35 day SMA | 623.62 | 619.91 | 616.35 | | 50 day SMA | 607.22 | 604.31 | 601.53 | | 100 day SMA | 601.55 | 600.57 | 599.56 | | 150 day SMA | 603.44 | 602.11 | 600.68 | | 200 day SMA | 590.35 | 589.74 | 589.16 |
|
|
