StandardIndustries SIL full analysis,charts,indicators,moving averages,SMA,DMA,EMA,ADX,MACD,RSIStandard Industries SIL WideScreen charts, DMA,SMA,EMA technical analysis, forecast prediction, by indicators ADX,MACD,RSI,CCI NSE stock exchange
operates under Commodity Chemicals sector
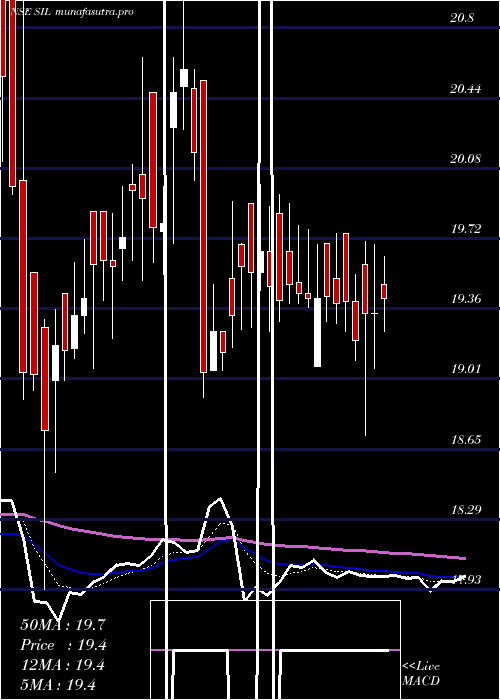
Daily price and charts and targets StandardIndustries Strong Daily Stock price targets for StandardIndustries SIL are 18.42 and 18.83 | Daily Target 1 | 18.31 | | Daily Target 2 | 18.53 | | Daily Target 3 | 18.723333333333 | | Daily Target 4 | 18.94 | | Daily Target 5 | 19.13 |
Daily price and volume Standard Industries
| Date |
Closing |
Open |
Range |
Volume |
Tue 28 October 2025 |
18.74 (-0.05%) |
18.85 |
18.51 - 18.92 |
0.3938 times |
Mon 27 October 2025 |
18.75 (-1.73%) |
18.83 |
18.63 - 19.08 |
0.4901 times |
Fri 24 October 2025 |
19.08 (-0.37%) |
19.15 |
18.71 - 19.50 |
1.0306 times |
Thu 23 October 2025 |
19.15 (0.1%) |
19.39 |
18.92 - 19.45 |
0.8355 times |
Tue 21 October 2025 |
19.13 (2.41%) |
19.50 |
18.95 - 19.50 |
0.2355 times |
Mon 20 October 2025 |
18.68 (-1.42%) |
19.50 |
18.22 - 19.50 |
0.9144 times |
Fri 17 October 2025 |
18.95 (-1.2%) |
19.45 |
18.61 - 19.60 |
1.6646 times |
Thu 16 October 2025 |
19.18 (5.04%) |
19.70 |
18.79 - 19.70 |
2.4603 times |
Wed 15 October 2025 |
18.26 (2.93%) |
18.25 |
17.95 - 18.45 |
0.638 times |
Tue 14 October 2025 |
17.74 (-2.58%) |
18.63 |
17.40 - 18.63 |
1.3372 times |
Mon 13 October 2025 |
18.21 (-2.67%) |
18.71 |
18.12 - 18.93 |
0.7899 times |
Weekly price and charts StandardIndustries Strong weekly Stock price targets for StandardIndustries SIL are 18.34 and 18.91 | Weekly Target 1 | 18.21 | | Weekly Target 2 | 18.47 | | Weekly Target 3 | 18.776666666667 | | Weekly Target 4 | 19.04 | | Weekly Target 5 | 19.35 |
Weekly price and volumes for Standard Industries
| Date |
Closing |
Open |
Range |
Volume |
Tue 28 October 2025 |
18.74 (-1.78%) |
18.83 |
18.51 - 19.08 |
0.2244 times |
Fri 24 October 2025 |
19.08 (0.69%) |
19.50 |
18.22 - 19.50 |
0.7658 times |
Fri 17 October 2025 |
18.95 (1.28%) |
18.71 |
17.40 - 19.70 |
1.7494 times |
Fri 10 October 2025 |
18.71 (0.05%) |
18.99 |
18.11 - 19.00 |
0.7326 times |
Fri 03 October 2025 |
18.70 (0.32%) |
18.71 |
18.21 - 19.19 |
0.5888 times |
Fri 26 September 2025 |
18.64 (-2.56%) |
19.99 |
17.50 - 19.99 |
1.1048 times |
Fri 19 September 2025 |
19.13 (-1.09%) |
19.73 |
19.00 - 19.74 |
1.5542 times |
Fri 12 September 2025 |
19.34 (4.2%) |
18.82 |
18.56 - 19.75 |
1.3264 times |
Fri 05 September 2025 |
18.56 (0.49%) |
18.35 |
17.91 - 18.99 |
1.252 times |
Fri 29 August 2025 |
18.47 (-2.17%) |
18.88 |
18.20 - 19.44 |
0.7016 times |
Fri 22 August 2025 |
18.88 (4.14%) |
18.50 |
18.07 - 19.49 |
1.281 times |
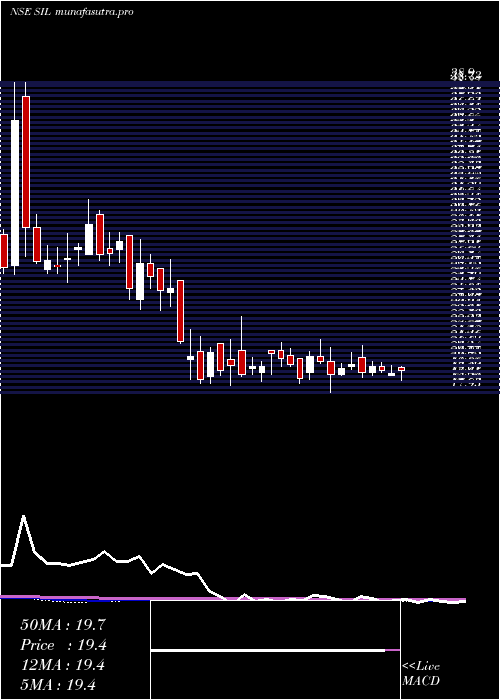
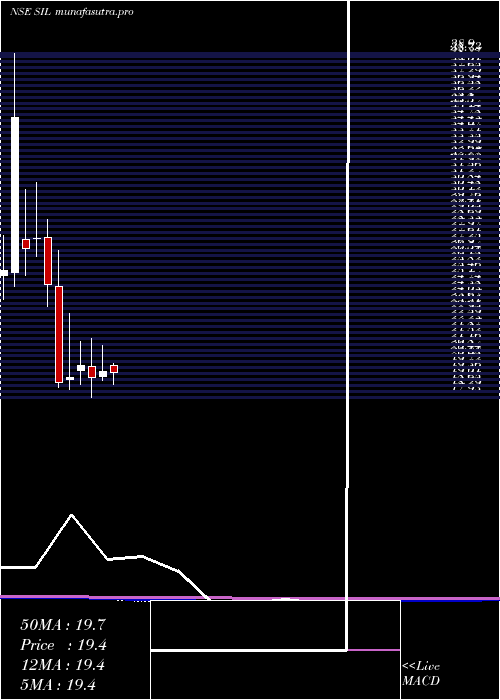
Monthly price and charts StandardIndustries Strong monthly Stock price targets for StandardIndustries SIL are 16.92 and 19.22 | Monthly Target 1 | 16.31 | | Monthly Target 2 | 17.53 | | Monthly Target 3 | 18.613333333333 | | Monthly Target 4 | 19.83 | | Monthly Target 5 | 20.91 |
Monthly price and volumes Standard Industries
| Date |
Closing |
Open |
Range |
Volume |
Tue 28 October 2025 |
18.74 (-0.11%) |
19.13 |
17.40 - 19.70 |
0.4174 times |
Tue 30 September 2025 |
18.76 (1.57%) |
18.35 |
17.50 - 19.99 |
0.6135 times |
Fri 29 August 2025 |
18.47 (-4.65%) |
19.51 |
18.00 - 19.78 |
0.4975 times |
Thu 31 July 2025 |
19.37 (-0.56%) |
19.85 |
18.20 - 21.71 |
1.6063 times |
Mon 30 June 2025 |
19.48 (1.72%) |
19.16 |
18.91 - 21.10 |
1.0435 times |
Fri 30 May 2025 |
19.15 (-3.67%) |
19.80 |
17.93 - 21.49 |
1.2736 times |
Wed 30 April 2025 |
19.88 (3.92%) |
19.54 |
18.67 - 21.34 |
0.6147 times |
Fri 28 March 2025 |
19.13 (1.76%) |
18.99 |
18.40 - 23.05 |
2.025 times |
Fri 28 February 2025 |
18.80 (-24.19%) |
24.70 |
18.50 - 26.90 |
0.7948 times |
Fri 31 January 2025 |
24.80 (-10.18%) |
27.65 |
23.45 - 28.74 |
1.1137 times |
Tue 31 December 2024 |
27.61 (2.22%) |
27.60 |
26.50 - 31.00 |
2.2452 times |
DMA SMA EMA moving averages of Standard Industries SIL
DMA (daily moving average) of Standard Industries SIL
| DMA period | DMA value | | 5 day DMA | 18.97 | | 12 day DMA | 18.72 | | 20 day DMA | 18.67 | | 35 day DMA | 18.86 | | 50 day DMA | 18.78 | | 100 day DMA | 19.12 | | 150 day DMA | 19.33 | | 200 day DMA | 20.18 | EMA (exponential moving average) of Standard Industries SIL
| EMA period | EMA current | EMA prev | EMA prev2 | | 5 day EMA | 18.85 | 18.91 | 18.99 | | 12 day EMA | 18.81 | 18.82 | 18.83 | | 20 day EMA | 18.79 | 18.79 | 18.79 | | 35 day EMA | 18.75 | 18.75 | 18.75 | | 50 day EMA | 18.78 | 18.78 | 18.78 |
SMA (simple moving average) of Standard Industries SIL
| SMA period | SMA current | SMA prev | SMA prev2 | | 5 day SMA | 18.97 | 18.96 | 19 | | 12 day SMA | 18.72 | 18.71 | 18.69 | | 20 day SMA | 18.67 | 18.67 | 18.68 | | 35 day SMA | 18.86 | 18.86 | 18.85 | | 50 day SMA | 18.78 | 18.77 | 18.76 | | 100 day SMA | 19.12 | 19.12 | 19.13 | | 150 day SMA | 19.33 | 19.34 | 19.34 | | 200 day SMA | 20.18 | 20.22 | 20.27 |
|
|
