SigmaSolve SIGMA_BE full analysis,charts,indicators,moving averages,SMA,DMA,EMA,ADX,MACD,RSISigma Solve SIGMA_BE WideScreen charts, DMA,SMA,EMA technical analysis, forecast prediction, by indicators ADX,MACD,RSI,CCI NSE stock exchange
Daily price and charts and targets SigmaSolve Strong Daily Stock price targets for SigmaSolve SIGMA_BE are 51.73 and 52.48 | Daily Target 1 | 51.6 | | Daily Target 2 | 51.85 | | Daily Target 3 | 52.35 | | Daily Target 4 | 52.6 | | Daily Target 5 | 53.1 |
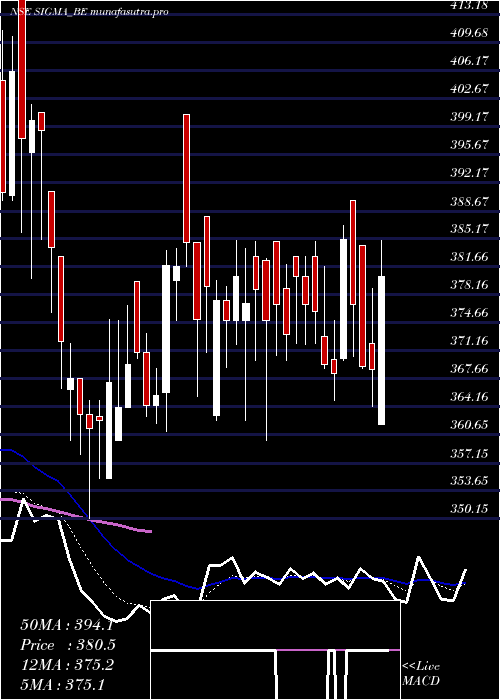
Daily price and volume Sigma Solve
| Date |
Closing |
Open |
Range |
Volume |
Tue 28 October 2025 |
52.10 (0%) |
52.65 |
52.10 - 52.85 |
0.5213 times |
Mon 27 October 2025 |
52.10 (0%) |
52.10 |
52.10 - 52.80 |
0.5511 times |
Fri 24 October 2025 |
52.10 (-0.19%) |
52.15 |
52.10 - 52.85 |
0.692 times |
Thu 23 October 2025 |
52.20 (-1.79%) |
53.45 |
52.10 - 53.90 |
0.9611 times |
Tue 21 October 2025 |
53.15 (1.05%) |
53.10 |
53.00 - 55.10 |
0.7799 times |
Mon 20 October 2025 |
52.60 (0.86%) |
52.10 |
52.10 - 52.85 |
0.7755 times |
Fri 17 October 2025 |
52.15 (-0.19%) |
52.25 |
52.10 - 52.75 |
0.4863 times |
Thu 16 October 2025 |
52.25 (-0.19%) |
52.30 |
52.10 - 52.90 |
1.1466 times |
Wed 15 October 2025 |
52.35 (0.48%) |
52.10 |
52.10 - 52.85 |
1.107 times |
Tue 14 October 2025 |
52.10 (0.19%) |
52.00 |
50.05 - 52.45 |
2.9793 times |
Mon 13 October 2025 |
52.00 (-1.05%) |
52.55 |
52.00 - 53.20 |
4.0821 times |
Weekly price and charts SigmaSolve Strong weekly Stock price targets for SigmaSolve SIGMA_BE are 51.73 and 52.48 | Weekly Target 1 | 51.6 | | Weekly Target 2 | 51.85 | | Weekly Target 3 | 52.35 | | Weekly Target 4 | 52.6 | | Weekly Target 5 | 53.1 |
Weekly price and volumes for Sigma Solve
| Date |
Closing |
Open |
Range |
Volume |
Tue 28 October 2025 |
52.10 (0%) |
52.10 |
52.10 - 52.85 |
0.467 times |
Fri 24 October 2025 |
52.10 (-0.1%) |
52.10 |
52.10 - 55.10 |
1.397 times |
Fri 17 October 2025 |
52.15 (-0.76%) |
52.55 |
50.05 - 53.20 |
4.2677 times |
Fri 10 October 2025 |
52.55 (-86.92%) |
52.90 |
51.70 - 53.70 |
3.1215 times |
Fri 29 August 2025 |
401.90 (0.75%) |
398.90 |
390.00 - 421.00 |
0.1463 times |
Fri 22 August 2025 |
398.90 (4.74%) |
390.00 |
385.00 - 401.00 |
0.0883 times |
Thu 14 August 2025 |
380.85 (-0.35%) |
391.20 |
368.00 - 391.20 |
0.09 times |
Fri 08 August 2025 |
382.20 (0.41%) |
380.65 |
368.55 - 410.00 |
0.2322 times |
Fri 01 August 2025 |
380.65 (-1.17%) |
384.05 |
375.00 - 389.00 |
0.1047 times |
Fri 25 July 2025 |
385.15 (0.82%) |
380.00 |
380.00 - 396.00 |
0.0852 times |
Fri 18 July 2025 |
382.00 (1.35%) |
384.40 |
362.00 - 395.00 |
0.078 times |
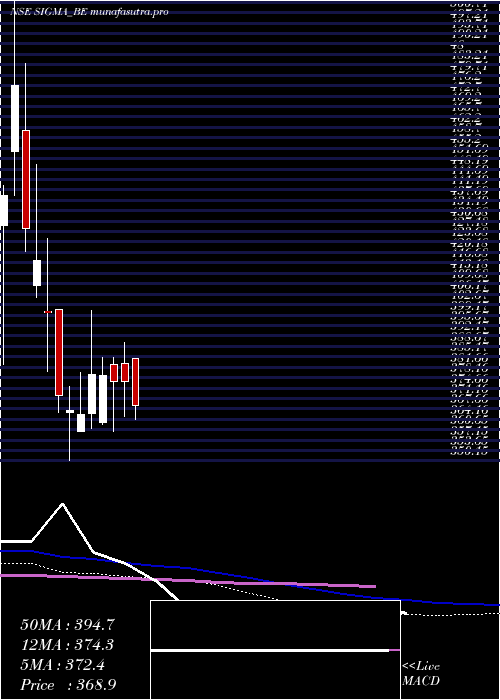
Monthly price and charts SigmaSolve Strong monthly Stock price targets for SigmaSolve SIGMA_BE are 48.55 and 53.6 | Monthly Target 1 | 47.37 | | Monthly Target 2 | 49.73 | | Monthly Target 3 | 52.416666666667 | | Monthly Target 4 | 54.78 | | Monthly Target 5 | 57.47 |
Monthly price and volumes Sigma Solve
| Date |
Closing |
Open |
Range |
Volume |
Tue 28 October 2025 |
52.10 (-87.04%) |
52.90 |
50.05 - 55.10 |
5.7461 times |
Fri 29 August 2025 |
401.90 (5.75%) |
386.00 |
368.00 - 421.00 |
0.3585 times |
Thu 31 July 2025 |
380.05 (1.35%) |
384.85 |
362.00 - 396.00 |
0.2337 times |
Mon 30 June 2025 |
375.00 (0.73%) |
366.30 |
350.15 - 400.70 |
0.2951 times |
Fri 30 May 2025 |
372.30 (-6.63%) |
391.15 |
366.50 - 391.15 |
0.0206 times |
Mon 11 September 2023 |
398.75 (-5.41%) |
429.70 |
380.20 - 429.70 |
0.0877 times |
Thu 31 August 2023 |
421.55 (0%) |
490.00 |
382.60 - 509.00 |
0.2583 times |
Tue 28 October 2025 |
(0%) |
|
- |
0 times |

DMA SMA EMA moving averages of Sigma Solve SIGMA_BE
DMA (daily moving average) of Sigma Solve SIGMA_BE
| DMA period | DMA value | | 5 day DMA | 52.33 | | 12 day DMA | 52.3 | | 20 day DMA | 175.2 | | 35 day DMA | 265.21 | | 50 day DMA | 299.82 | | 100 day DMA | 349.81 | | 150 day DMA | | | 200 day DMA | | EMA (exponential moving average) of Sigma Solve SIGMA_BE
| EMA period | EMA current | EMA prev | EMA prev2 | | 5 day EMA | 54.01 | 54.97 | 56.41 | | 12 day EMA | 91.78 | 98.99 | 107.51 | | 20 day EMA | 145.42 | 155.24 | 166.09 | | 35 day EMA | 212.45 | 221.89 | 231.89 | | 50 day EMA | 281.53 | 290.89 | 300.63 |
SMA (simple moving average) of Sigma Solve SIGMA_BE
| SMA period | SMA current | SMA prev | SMA prev2 | | 5 day SMA | 52.33 | 52.43 | 52.44 | | 12 day SMA | 52.3 | 52.3 | 81.45 | | 20 day SMA | 175.2 | 192.09 | 208.96 | | 35 day SMA | 265.21 | 274.66 | 284.18 | | 50 day SMA | 299.82 | 306.29 | 312.79 | | 100 day SMA | 349.81 | 353.31 | 357.03 | | 150 day SMA | | 200 day SMA |
|
|
