SignetIndustries SIGIND_BE full analysis,charts,indicators,moving averages,SMA,DMA,EMA,ADX,MACD,RSISignet Industries SIGIND_BE WideScreen charts, DMA,SMA,EMA technical analysis, forecast prediction, by indicators ADX,MACD,RSI,CCI NSE stock exchange
Daily price and charts and targets SignetIndustries Strong Daily Stock price targets for SignetIndustries SIGIND_BE are 56.06 and 60.06 | Daily Target 1 | 52.84 | | Daily Target 2 | 55.27 | | Daily Target 3 | 56.836666666667 | | Daily Target 4 | 59.27 | | Daily Target 5 | 60.84 |
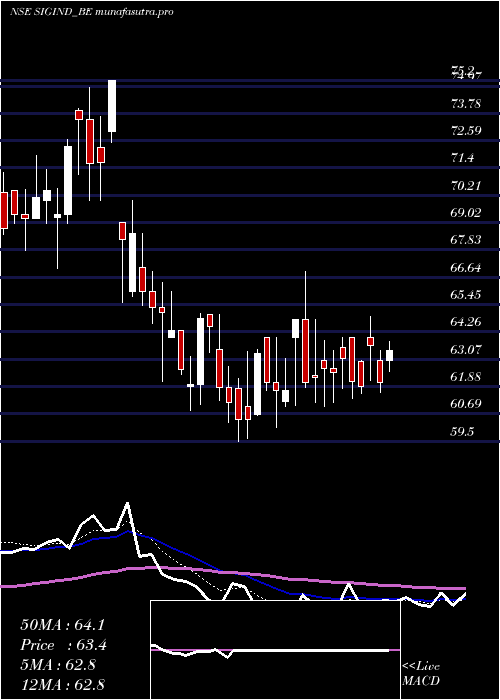
Daily price and volume Signet Industries
| Date |
Closing |
Open |
Range |
Volume |
Wed 03 September 2025 |
57.71 (2.81%) |
54.40 |
54.40 - 58.40 |
1.9977 times |
Tue 02 September 2025 |
56.13 (0.68%) |
56.50 |
53.15 - 57.00 |
0.7729 times |
Mon 01 September 2025 |
55.75 (1.92%) |
54.77 |
52.31 - 56.50 |
0.593 times |
Fri 29 August 2025 |
54.70 (0.44%) |
54.46 |
54.00 - 57.00 |
1.2705 times |
Thu 28 August 2025 |
54.46 (-1.23%) |
54.00 |
52.46 - 56.00 |
0.9675 times |
Tue 26 August 2025 |
55.14 (-0.11%) |
57.50 |
54.00 - 57.50 |
0.7149 times |
Mon 25 August 2025 |
55.20 (-1.36%) |
55.96 |
54.01 - 56.70 |
0.7732 times |
Fri 22 August 2025 |
55.96 (0.77%) |
55.53 |
54.75 - 57.50 |
1.133 times |
Thu 21 August 2025 |
55.53 (0.82%) |
57.83 |
55.08 - 57.83 |
0.9539 times |
Wed 20 August 2025 |
55.08 (4.99%) |
52.00 |
50.55 - 55.08 |
0.8234 times |
Tue 19 August 2025 |
52.46 (0.04%) |
53.50 |
50.50 - 53.50 |
1.4965 times |
Weekly price and charts SignetIndustries Strong weekly Stock price targets for SignetIndustries SIGIND_BE are 55.01 and 61.1 | Weekly Target 1 | 50.05 | | Weekly Target 2 | 53.88 | | Weekly Target 3 | 56.14 | | Weekly Target 4 | 59.97 | | Weekly Target 5 | 62.23 |
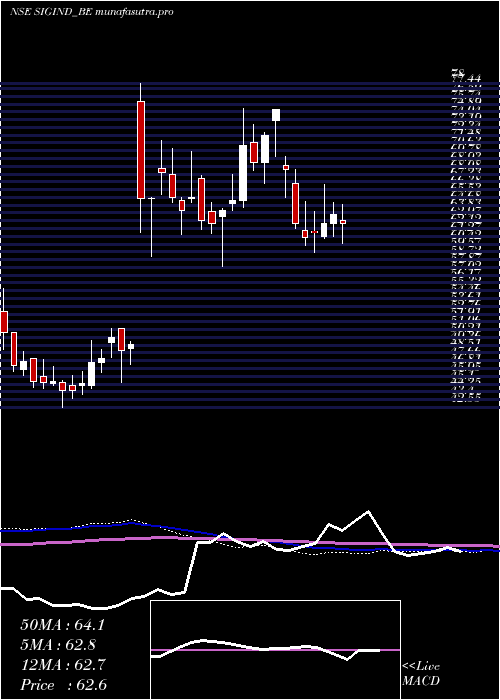
Weekly price and volumes for Signet Industries
| Date |
Closing |
Open |
Range |
Volume |
Wed 03 September 2025 |
57.71 (5.5%) |
54.77 |
52.31 - 58.40 |
0.6596 times |
Fri 29 August 2025 |
54.70 (-2.25%) |
55.96 |
52.46 - 57.50 |
0.7306 times |
Fri 22 August 2025 |
55.96 (3.98%) |
51.45 |
50.50 - 57.83 |
1.0891 times |
Thu 14 August 2025 |
53.82 (-2.11%) |
54.90 |
53.30 - 57.08 |
0.6313 times |
Fri 08 August 2025 |
54.98 (-3.75%) |
57.03 |
54.40 - 59.05 |
0.4865 times |
Fri 01 August 2025 |
57.12 (-4.1%) |
60.75 |
55.50 - 60.75 |
0.7564 times |
Fri 25 July 2025 |
59.56 (-1.59%) |
62.80 |
57.84 - 62.80 |
1.0605 times |
Fri 18 July 2025 |
60.52 (-4.93%) |
63.00 |
60.50 - 64.70 |
1.543 times |
Fri 11 July 2025 |
63.66 (1.61%) |
62.65 |
61.20 - 64.95 |
1.0583 times |
Fri 04 July 2025 |
62.65 (1.52%) |
61.21 |
61.00 - 66.89 |
1.9846 times |
Fri 27 June 2025 |
61.71 (0.87%) |
61.79 |
59.50 - 64.00 |
1.3991 times |
Monthly price and charts SignetIndustries Strong monthly Stock price targets for SignetIndustries SIGIND_BE are 55.01 and 61.1 | Monthly Target 1 | 50.05 | | Monthly Target 2 | 53.88 | | Monthly Target 3 | 56.14 | | Monthly Target 4 | 59.97 | | Monthly Target 5 | 62.23 |
Monthly price and volumes Signet Industries
| Date |
Closing |
Open |
Range |
Volume |
Wed 03 September 2025 |
57.71 (5.5%) |
54.77 |
52.31 - 58.40 |
0.0594 times |
Fri 29 August 2025 |
54.70 (-4.65%) |
57.37 |
50.50 - 59.05 |
0.2728 times |
Thu 31 July 2025 |
57.37 (-7.05%) |
64.00 |
55.50 - 66.89 |
0.5462 times |
Mon 30 June 2025 |
61.72 (-17.93%) |
69.01 |
59.50 - 70.00 |
0.633 times |
Thu 25 January 2024 |
75.20 (15.34%) |
65.15 |
64.40 - 75.30 |
3.3193 times |
Fri 29 December 2023 |
65.20 (-2.18%) |
66.65 |
58.00 - 69.50 |
1.4687 times |
Thu 30 November 2023 |
66.65 (8.46%) |
63.40 |
59.05 - 71.80 |
1.3928 times |
Tue 31 October 2023 |
61.45 (24.39%) |
76.00 |
61.15 - 78.00 |
0.7178 times |
Fri 22 September 2023 |
49.40 (4.33%) |
48.45 |
45.30 - 51.20 |
0.6666 times |
Thu 31 August 2023 |
47.35 (5.69%) |
45.45 |
42.55 - 49.90 |
0.9233 times |
Mon 31 July 2023 |
44.80 (-4.88%) |
46.65 |
44.40 - 48.65 |
0.9035 times |

DMA SMA EMA moving averages of Signet Industries SIGIND_BE
DMA (daily moving average) of Signet Industries SIGIND_BE
| DMA period | DMA value | | 5 day DMA | 55.75 | | 12 day DMA | 55.05 | | 20 day DMA | 55.55 | | 35 day DMA | 57.33 | | 50 day DMA | 58.86 | | 100 day DMA | 62.65 | | 150 day DMA | 61.29 | | 200 day DMA | | EMA (exponential moving average) of Signet Industries SIGIND_BE
| EMA period | EMA current | EMA prev | EMA prev2 | | 5 day EMA | 56.22 | 55.47 | 55.14 | | 12 day EMA | 55.76 | 55.41 | 55.28 | | 20 day EMA | 56.09 | 55.92 | 55.9 | | 35 day EMA | 57.33 | 57.31 | 57.38 | | 50 day EMA | 58.87 | 58.92 | 59.03 |
SMA (simple moving average) of Signet Industries SIGIND_BE
| SMA period | SMA current | SMA prev | SMA prev2 | | 5 day SMA | 55.75 | 55.24 | 55.05 | | 12 day SMA | 55.05 | 54.72 | 54.72 | | 20 day SMA | 55.55 | 55.51 | 55.56 | | 35 day SMA | 57.33 | 57.45 | 57.67 | | 50 day SMA | 58.86 | 58.91 | 59.01 | | 100 day SMA | 62.65 | 62.74 | 62.84 | | 150 day SMA | 61.29 | 61.23 | 61.18 | | 200 day SMA |
|
|
