SignetIndustries SIGIND full analysis,charts,indicators,moving averages,SMA,DMA,EMA,ADX,MACD,RSISignet Industries SIGIND WideScreen charts, DMA,SMA,EMA technical analysis, forecast prediction, by indicators ADX,MACD,RSI,CCI NSE stock exchange
Daily price and charts and targets SignetIndustries Strong Daily Stock price targets for SignetIndustries SIGIND are 57.4 and 59.9 | Daily Target 1 | 55.43 | | Daily Target 2 | 56.86 | | Daily Target 3 | 57.93 | | Daily Target 4 | 59.36 | | Daily Target 5 | 60.43 |
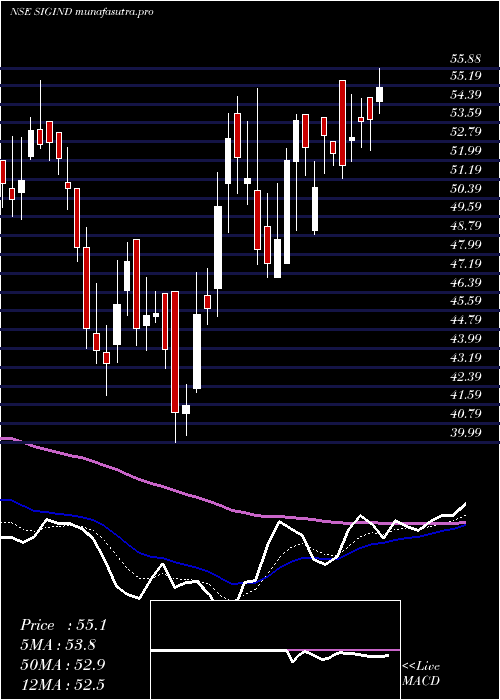
Daily price and volume Signet Industries
| Date |
Closing |
Open |
Range |
Volume |
Wed 29 October 2025 |
58.29 (0.07%) |
57.95 |
56.50 - 59.00 |
0.3584 times |
Tue 28 October 2025 |
58.25 (0.99%) |
59.59 |
57.11 - 59.60 |
0.08 times |
Mon 27 October 2025 |
57.68 (-1.9%) |
59.99 |
57.40 - 60.54 |
0.3497 times |
Fri 24 October 2025 |
58.80 (0.5%) |
58.99 |
58.01 - 60.60 |
0.4132 times |
Thu 23 October 2025 |
58.51 (-1.5%) |
60.00 |
58.10 - 60.02 |
0.545 times |
Tue 21 October 2025 |
59.40 (0.83%) |
60.80 |
57.80 - 60.80 |
0.2184 times |
Mon 20 October 2025 |
58.91 (-1.27%) |
60.10 |
57.30 - 61.85 |
1.7764 times |
Fri 17 October 2025 |
59.67 (-0.05%) |
60.60 |
58.60 - 61.95 |
1.9537 times |
Thu 16 October 2025 |
59.70 (3.18%) |
59.79 |
58.50 - 60.50 |
1.6714 times |
Wed 15 October 2025 |
57.86 (2.53%) |
57.96 |
57.10 - 59.95 |
2.634 times |
Tue 14 October 2025 |
56.43 (-0.53%) |
58.40 |
55.10 - 58.84 |
0.752 times |
Weekly price and charts SignetIndustries Strong weekly Stock price targets for SignetIndustries SIGIND are 55.38 and 59.42 | Weekly Target 1 | 54.4 | | Weekly Target 2 | 56.35 | | Weekly Target 3 | 58.443333333333 | | Weekly Target 4 | 60.39 | | Weekly Target 5 | 62.48 |
Weekly price and volumes for Signet Industries
| Date |
Closing |
Open |
Range |
Volume |
Wed 29 October 2025 |
58.29 (-0.87%) |
59.99 |
56.50 - 60.54 |
0.0465 times |
Fri 24 October 2025 |
58.80 (-1.46%) |
60.10 |
57.30 - 61.85 |
0.1742 times |
Fri 17 October 2025 |
59.67 (9.39%) |
54.55 |
53.02 - 61.95 |
0.5677 times |
Fri 10 October 2025 |
54.55 (3.81%) |
52.65 |
50.35 - 55.77 |
0.2535 times |
Fri 03 October 2025 |
52.55 (1.02%) |
52.02 |
50.11 - 53.10 |
0.2859 times |
Fri 26 September 2025 |
52.02 (-6.34%) |
56.98 |
51.73 - 56.98 |
0.3827 times |
Fri 19 September 2025 |
55.54 (1.98%) |
54.40 |
53.54 - 57.18 |
0.3135 times |
Fri 12 September 2025 |
54.46 (-21.08%) |
57.00 |
53.57 - 57.00 |
0.2239 times |
Wed 04 June 2025 |
69.01 (10.36%) |
67.98 |
67.00 - 81.00 |
7.2352 times |
Fri 30 May 2025 |
62.53 (12.36%) |
54.32 |
54.32 - 63.00 |
0.517 times |
Fri 23 May 2025 |
55.65 (0.2%) |
55.54 |
54.26 - 57.00 |
0.1292 times |

Monthly price and charts SignetIndustries Strong monthly Stock price targets for SignetIndustries SIGIND are 54.2 and 66.04 | Monthly Target 1 | 44.94 | | Monthly Target 2 | 51.62 | | Monthly Target 3 | 56.783333333333 | | Monthly Target 4 | 63.46 | | Monthly Target 5 | 68.62 |
Monthly price and volumes Signet Industries
| Date |
Closing |
Open |
Range |
Volume |
Wed 29 October 2025 |
58.29 (14.47%) |
50.11 |
50.11 - 61.95 |
0.4682 times |
Tue 30 September 2025 |
50.92 (-26.21%) |
57.00 |
50.44 - 57.18 |
0.4597 times |
Wed 04 June 2025 |
69.01 (10.36%) |
67.98 |
67.00 - 81.00 |
2.9867 times |
Fri 30 May 2025 |
62.53 (30.08%) |
47.50 |
46.25 - 63.00 |
0.607 times |
Wed 30 April 2025 |
48.07 (1.01%) |
47.00 |
47.00 - 56.81 |
0.4271 times |
Fri 28 March 2025 |
47.59 (-1.43%) |
48.28 |
39.99 - 55.03 |
1.5386 times |
Fri 28 February 2025 |
48.28 (-18.56%) |
57.50 |
47.71 - 63.25 |
0.4862 times |
Fri 31 January 2025 |
59.28 (-17.77%) |
70.40 |
52.20 - 72.98 |
0.6889 times |
Tue 31 December 2024 |
72.09 (2.87%) |
71.94 |
67.25 - 80.80 |
1.601 times |
Fri 29 November 2024 |
70.08 (-1.41%) |
71.90 |
65.60 - 76.50 |
0.7367 times |
Thu 31 October 2024 |
71.08 (-5.04%) |
75.60 |
64.31 - 76.80 |
1.2013 times |

DMA SMA EMA moving averages of Signet Industries SIGIND
DMA (daily moving average) of Signet Industries SIGIND
| DMA period | DMA value | | 5 day DMA | 58.31 | | 12 day DMA | 58.35 | | 20 day DMA | 55.96 | | 35 day DMA | 55.34 | | 50 day DMA | 56.77 | | 100 day DMA | 53.22 | | 150 day DMA | 56.6 | | 200 day DMA | 60.19 | EMA (exponential moving average) of Signet Industries SIGIND
| EMA period | EMA current | EMA prev | EMA prev2 | | 5 day EMA | 58.31 | 58.32 | 58.35 | | 12 day EMA | 57.71 | 57.61 | 57.49 | | 20 day EMA | 56.99 | 56.85 | 56.7 | | 35 day EMA | 56.74 | 56.65 | 56.56 | | 50 day EMA | 56.58 | 56.51 | 56.44 |
SMA (simple moving average) of Signet Industries SIGIND
| SMA period | SMA current | SMA prev | SMA prev2 | | 5 day SMA | 58.31 | 58.53 | 58.66 | | 12 day SMA | 58.35 | 58.04 | 57.51 | | 20 day SMA | 55.96 | 55.62 | 55.31 | | 35 day SMA | 55.34 | 55.65 | 56.04 | | 50 day SMA | 56.77 | 56.69 | 56.6 | | 100 day SMA | 53.22 | 53.17 | 53.11 | | 150 day SMA | 56.6 | 56.71 | 56.81 | | 200 day SMA | 60.19 | 60.27 | 60.35 |
|
|
