SigachiIndustries SIGACHI full analysis,charts,indicators,moving averages,SMA,DMA,EMA,ADX,MACD,RSISigachi Industries SIGACHI WideScreen charts, DMA,SMA,EMA technical analysis, forecast prediction, by indicators ADX,MACD,RSI,CCI NSE stock exchange
Daily price and charts and targets SigachiIndustries Strong Daily Stock price targets for SigachiIndustries SIGACHI are 35.81 and 37.68 | Daily Target 1 | 35.43 | | Daily Target 2 | 36.19 | | Daily Target 3 | 37.296666666667 | | Daily Target 4 | 38.06 | | Daily Target 5 | 39.17 |
Daily price and volume Sigachi Industries
| Date |
Closing |
Open |
Range |
Volume |
Tue 28 October 2025 |
36.96 (-2.76%) |
38.02 |
36.53 - 38.40 |
1.4844 times |
Mon 27 October 2025 |
38.01 (-2.54%) |
38.41 |
37.40 - 38.44 |
1.2698 times |
Fri 24 October 2025 |
39.00 (0.23%) |
38.70 |
38.70 - 39.45 |
0.9046 times |
Thu 23 October 2025 |
38.91 (0.86%) |
38.94 |
38.40 - 39.57 |
1.0759 times |
Tue 21 October 2025 |
38.58 (0.97%) |
38.21 |
38.21 - 38.70 |
0.2 times |
Mon 20 October 2025 |
38.21 (-0.49%) |
38.41 |
37.56 - 38.64 |
0.8061 times |
Fri 17 October 2025 |
38.40 (0.34%) |
38.35 |
37.80 - 38.86 |
1.0697 times |
Thu 16 October 2025 |
38.27 (0.74%) |
38.07 |
38.06 - 38.88 |
0.9888 times |
Wed 15 October 2025 |
37.99 (0.08%) |
37.90 |
37.72 - 38.20 |
0.959 times |
Tue 14 October 2025 |
37.96 (-2.77%) |
39.42 |
37.53 - 39.42 |
1.2416 times |
Mon 13 October 2025 |
39.04 (-1.29%) |
39.16 |
38.65 - 39.58 |
1.0776 times |
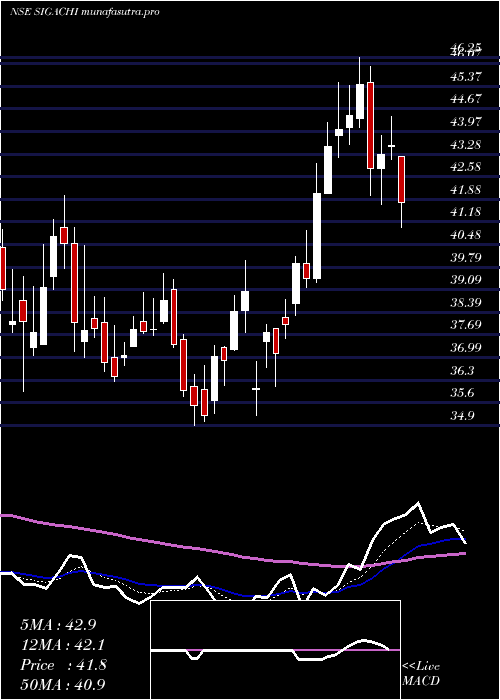
Weekly price and charts SigachiIndustries Strong weekly Stock price targets for SigachiIndustries SIGACHI are 35.79 and 37.7 | Weekly Target 1 | 35.4 | | Weekly Target 2 | 36.18 | | Weekly Target 3 | 37.31 | | Weekly Target 4 | 38.09 | | Weekly Target 5 | 39.22 |
Weekly price and volumes for Sigachi Industries
| Date |
Closing |
Open |
Range |
Volume |
Tue 28 October 2025 |
36.96 (-5.23%) |
38.41 |
36.53 - 38.44 |
0.0803 times |
Fri 24 October 2025 |
39.00 (1.56%) |
38.41 |
37.56 - 39.57 |
0.0871 times |
Fri 17 October 2025 |
38.40 (-2.91%) |
39.16 |
37.53 - 39.58 |
0.1557 times |
Fri 10 October 2025 |
39.55 (-1.42%) |
40.05 |
38.16 - 40.29 |
0.2323 times |
Fri 03 October 2025 |
40.12 (5.33%) |
38.29 |
37.27 - 40.85 |
0.3103 times |
Fri 26 September 2025 |
38.09 (-13.82%) |
44.20 |
37.50 - 44.20 |
0.509 times |
Fri 19 September 2025 |
44.20 (3.1%) |
42.79 |
40.86 - 46.73 |
4.8308 times |
Fri 12 September 2025 |
42.87 (36.27%) |
31.59 |
31.26 - 43.80 |
3.5276 times |
Fri 05 September 2025 |
31.46 (1.45%) |
31.15 |
30.95 - 32.66 |
0.1548 times |
Fri 29 August 2025 |
31.01 (-1.24%) |
31.42 |
30.54 - 31.98 |
0.1121 times |
Fri 22 August 2025 |
31.40 (2.38%) |
31.00 |
30.53 - 31.86 |
0.2154 times |
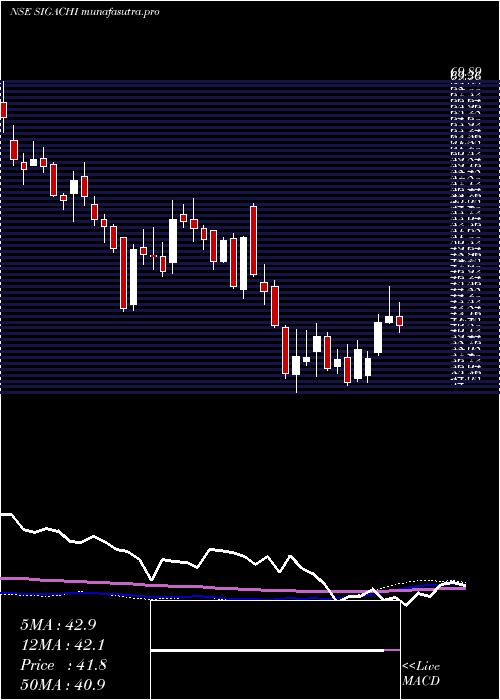
Monthly price and charts SigachiIndustries Strong monthly Stock price targets for SigachiIndustries SIGACHI are 34.59 and 38.91 | Monthly Target 1 | 33.79 | | Monthly Target 2 | 35.38 | | Monthly Target 3 | 38.113333333333 | | Monthly Target 4 | 39.7 | | Monthly Target 5 | 42.43 |
Monthly price and volumes Sigachi Industries
| Date |
Closing |
Open |
Range |
Volume |
Tue 28 October 2025 |
36.96 (-4.5%) |
39.08 |
36.53 - 40.85 |
0.3622 times |
Tue 30 September 2025 |
38.70 (24.8%) |
31.15 |
30.95 - 46.73 |
4.8902 times |
Fri 29 August 2025 |
31.01 (-17.94%) |
37.51 |
30.51 - 38.00 |
0.5843 times |
Thu 31 July 2025 |
37.79 (-22.5%) |
47.94 |
37.49 - 47.94 |
1.6994 times |
Mon 30 June 2025 |
48.76 (-7.69%) |
53.00 |
47.00 - 59.59 |
1.0614 times |
Fri 30 May 2025 |
52.82 (26.42%) |
41.78 |
38.00 - 53.29 |
0.3723 times |
Wed 30 April 2025 |
41.78 (18.73%) |
35.68 |
35.20 - 46.25 |
0.3088 times |
Fri 28 March 2025 |
35.19 (-7.64%) |
38.75 |
34.90 - 42.00 |
0.2051 times |
Fri 28 February 2025 |
38.10 (-16.48%) |
46.30 |
34.00 - 47.00 |
0.2906 times |
Fri 31 January 2025 |
45.62 (-8.65%) |
50.00 |
44.21 - 55.80 |
0.2258 times |
Tue 31 December 2024 |
49.94 (-7.38%) |
54.60 |
48.25 - 56.45 |
0.1739 times |

DMA SMA EMA moving averages of Sigachi Industries SIGACHI
DMA (daily moving average) of Sigachi Industries SIGACHI
| DMA period | DMA value | | 5 day DMA | 38.29 | | 12 day DMA | 38.41 | | 20 day DMA | 38.72 | | 35 day DMA | 39.22 | | 50 day DMA | 36.85 | | 100 day DMA | 40.88 | | 150 day DMA | 41.41 | | 200 day DMA | 41.67 | EMA (exponential moving average) of Sigachi Industries SIGACHI
| EMA period | EMA current | EMA prev | EMA prev2 | | 5 day EMA | 37.98 | 38.49 | 38.73 | | 12 day EMA | 38.38 | 38.64 | 38.75 | | 20 day EMA | 38.48 | 38.64 | 38.71 | | 35 day EMA | 37.46 | 37.49 | 37.46 | | 50 day EMA | 36.58 | 36.56 | 36.5 |
SMA (simple moving average) of Sigachi Industries SIGACHI
| SMA period | SMA current | SMA prev | SMA prev2 | | 5 day SMA | 38.29 | 38.54 | 38.62 | | 12 day SMA | 38.41 | 38.56 | 38.65 | | 20 day SMA | 38.72 | 38.77 | 38.82 | | 35 day SMA | 39.22 | 39.06 | 38.87 | | 50 day SMA | 36.85 | 36.73 | 36.6 | | 100 day SMA | 40.88 | 41.07 | 41.25 | | 150 day SMA | 41.41 | 41.41 | 41.41 | | 200 day SMA | 41.67 | 41.73 | 41.8 |
|
|
