ShreeRama SHREERAMA_BE full analysis,charts,indicators,moving averages,SMA,DMA,EMA,ADX,MACD,RSIShree Rama SHREERAMA_BE WideScreen charts, DMA,SMA,EMA technical analysis, forecast prediction, by indicators ADX,MACD,RSI,CCI NSE stock exchange
Daily price and charts and targets ShreeRama Strong Daily Stock price targets for ShreeRama SHREERAMA_BE are 58.09 and 60.33 | Daily Target 1 | 56.4 | | Daily Target 2 | 57.54 | | Daily Target 3 | 58.64 | | Daily Target 4 | 59.78 | | Daily Target 5 | 60.88 |
Daily price and volume Shree Rama
| Date |
Closing |
Open |
Range |
Volume |
Tue 28 October 2025 |
58.68 (0.93%) |
58.30 |
57.50 - 59.74 |
0.5829 times |
Mon 27 October 2025 |
58.14 (-1.61%) |
58.00 |
57.01 - 59.39 |
0.8752 times |
Fri 24 October 2025 |
59.09 (-0.42%) |
58.70 |
58.52 - 59.74 |
0.498 times |
Thu 23 October 2025 |
59.34 (-0.84%) |
60.19 |
59.00 - 61.50 |
1.5755 times |
Tue 21 October 2025 |
59.84 (2.5%) |
58.96 |
58.00 - 60.45 |
0.5672 times |
Mon 20 October 2025 |
58.38 (-0.7%) |
58.08 |
58.00 - 60.50 |
0.7496 times |
Fri 17 October 2025 |
58.79 (4.85%) |
55.23 |
55.23 - 58.87 |
1.7646 times |
Thu 16 October 2025 |
56.07 (-1.94%) |
58.34 |
55.51 - 58.34 |
0.4657 times |
Wed 15 October 2025 |
57.18 (3.38%) |
55.31 |
55.01 - 57.68 |
1.6822 times |
Tue 14 October 2025 |
55.31 (-1.97%) |
56.39 |
54.26 - 56.85 |
1.2391 times |
Mon 13 October 2025 |
56.42 (-3.31%) |
56.65 |
55.75 - 58.00 |
2.2176 times |
Weekly price and charts ShreeRama Strong weekly Stock price targets for ShreeRama SHREERAMA_BE are 57.85 and 60.58 | Weekly Target 1 | 55.75 | | Weekly Target 2 | 57.21 | | Weekly Target 3 | 58.476666666667 | | Weekly Target 4 | 59.94 | | Weekly Target 5 | 61.21 |
Weekly price and volumes for Shree Rama
| Date |
Closing |
Open |
Range |
Volume |
Tue 28 October 2025 |
58.68 (-0.69%) |
58.00 |
57.01 - 59.74 |
0.3244 times |
Fri 24 October 2025 |
59.09 (0.51%) |
58.08 |
58.00 - 61.50 |
0.7544 times |
Fri 17 October 2025 |
58.79 (0.75%) |
56.65 |
54.26 - 58.87 |
1.6397 times |
Fri 10 October 2025 |
58.35 (-2.21%) |
59.99 |
57.00 - 62.25 |
1.6167 times |
Fri 03 October 2025 |
59.67 (1.93%) |
58.90 |
57.71 - 62.40 |
0.9534 times |
Fri 26 September 2025 |
58.54 (-3.45%) |
60.88 |
55.65 - 62.87 |
1.0141 times |
Fri 19 September 2025 |
60.63 (6.48%) |
56.06 |
56.06 - 63.80 |
1.4043 times |
Fri 12 September 2025 |
56.94 (64%) |
61.96 |
56.13 - 61.96 |
1.6033 times |
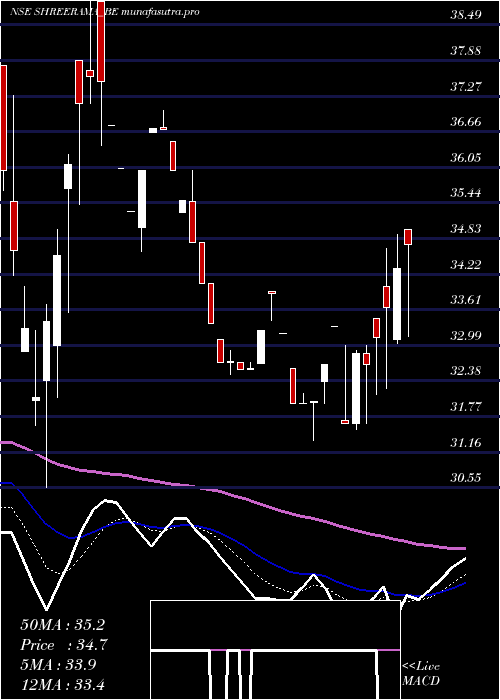
Thu 17 April 2025 |
34.72 (4.8%) |
34.00 |
32.25 - 34.99 |
0.234 times |
Fri 11 April 2025 |
33.13 (-0.57%) |
31.70 |
31.55 - 33.45 |
0.4556 times |
Fri 04 April 2025 |
33.32 (4.13%) |
32.00 |
31.36 - 33.32 |
0.343 times |
Monthly price and charts ShreeRama Strong monthly Stock price targets for ShreeRama SHREERAMA_BE are 52.48 and 60.47 | Monthly Target 1 | 50.41 | | Monthly Target 2 | 54.54 | | Monthly Target 3 | 58.396666666667 | | Monthly Target 4 | 62.53 | | Monthly Target 5 | 66.39 |
Monthly price and volumes Shree Rama
| Date |
Closing |
Open |
Range |
Volume |
Tue 28 October 2025 |
58.68 (-3.68%) |
61.36 |
54.26 - 62.25 |
1.4578 times |
Tue 30 September 2025 |
60.92 (75.46%) |
61.96 |
55.65 - 63.80 |
1.4334 times |
Thu 17 April 2025 |
34.72 (8.5%) |
32.00 |
31.36 - 34.99 |
0.3207 times |
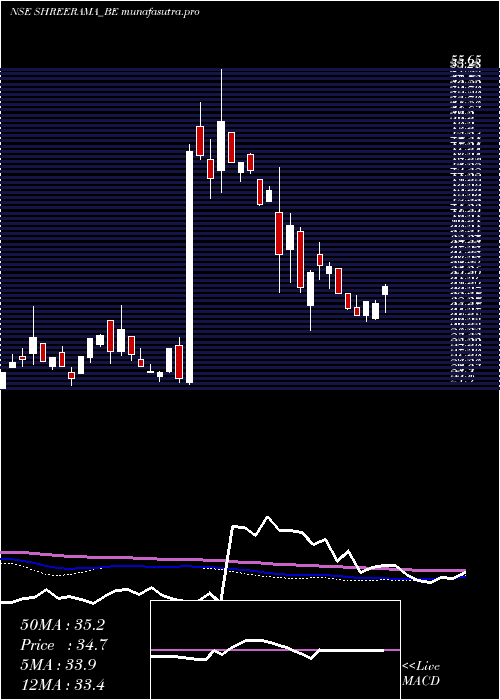
Fri 28 March 2025 |
32.00 (-12.97%) |
36.03 |
32.00 - 37.03 |
0.3051 times |
Fri 28 February 2025 |
36.77 (-2.72%) |
38.29 |
30.55 - 41.79 |
1.1241 times |
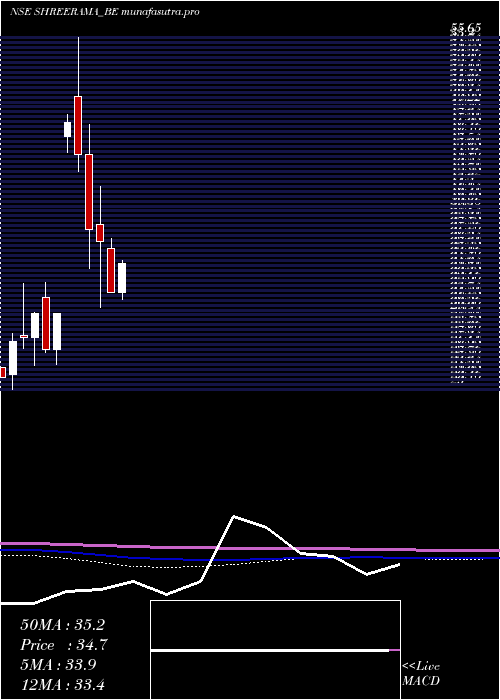
Fri 31 January 2025 |
37.80 (-15.72%) |
44.85 |
34.21 - 47.63 |
1.0406 times |
Tue 31 December 2024 |
44.85 (-6.11%) |
50.15 |
43.25 - 55.65 |
1.7942 times |
Fri 29 November 2024 |
47.77 (59.29%) |
46.50 |
45.00 - 48.50 |
0.0902 times |
Thu 31 October 2024 |
29.99 (12.32%) |
26.70 |
25.30 - 29.99 |
1.0984 times |
Mon 30 September 2024 |
26.70 (-11%) |
31.50 |
26.46 - 32.90 |
1.3356 times |
Fri 30 August 2024 |
30.00 (7.84%) |
27.82 |
25.24 - 30.09 |
0.7345 times |
DMA SMA EMA moving averages of Shree Rama SHREERAMA_BE
DMA (daily moving average) of Shree Rama SHREERAMA_BE
| DMA period | DMA value | | 5 day DMA | 59.02 | | 12 day DMA | 57.97 | | 20 day DMA | 58.73 | | 35 day DMA | 58.46 | | 50 day DMA | 50.79 | | 100 day DMA | 44.58 | | 150 day DMA | 42.47 | | 200 day DMA | 38.94 | EMA (exponential moving average) of Shree Rama SHREERAMA_BE
| EMA period | EMA current | EMA prev | EMA prev2 | | 5 day EMA | 58.65 | 58.63 | 58.87 | | 12 day EMA | 58.46 | 58.42 | 58.47 | | 20 day EMA | 57.79 | 57.7 | 57.65 | | 35 day EMA | 53.85 | 53.57 | 53.3 | | 50 day EMA | 50.15 | 49.8 | 49.46 |
SMA (simple moving average) of Shree Rama SHREERAMA_BE
| SMA period | SMA current | SMA prev | SMA prev2 | | 5 day SMA | 59.02 | 58.96 | 59.09 | | 12 day SMA | 57.97 | 58.01 | 58.13 | | 20 day SMA | 58.73 | 58.73 | 58.72 | | 35 day SMA | 58.46 | 57.76 | 57.06 | | 50 day SMA | 50.79 | 50.26 | 49.75 | | 100 day SMA | 44.58 | 44.46 | 44.35 | | 150 day SMA | 42.47 | 42.26 | 42.05 | | 200 day SMA | 38.94 | 38.79 | 38.64 |
|
|
