SH SHK full analysis,charts,indicators,moving averages,SMA,DMA,EMA,ADX,MACD,RSIS H SHK WideScreen charts, DMA,SMA,EMA technical analysis, forecast prediction, by indicators ADX,MACD,RSI,CCI NSE stock exchange
Daily price and charts and targets SH Strong Daily Stock price targets for SH SHK are 222.57 and 233.65 | Daily Target 1 | 213.91 | | Daily Target 2 | 220.15 | | Daily Target 3 | 224.99 | | Daily Target 4 | 231.23 | | Daily Target 5 | 236.07 |
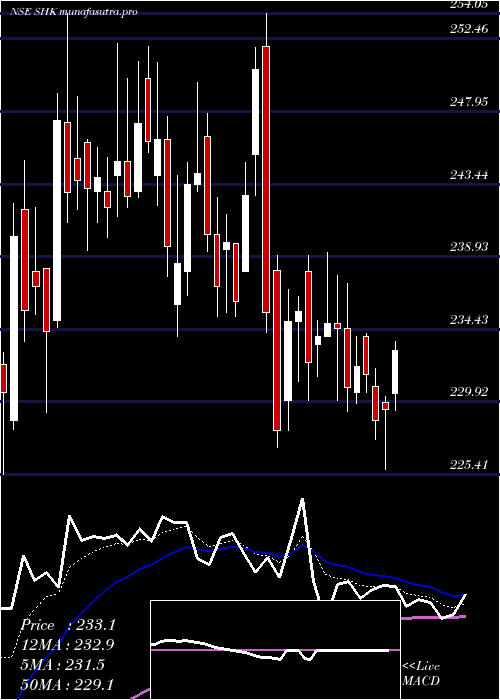
Daily price and volume S H
| Date |
Closing |
Open |
Range |
Volume |
Wed 29 October 2025 |
226.39 (3.63%) |
219.00 |
218.75 - 229.83 |
1.0134 times |
Tue 28 October 2025 |
218.45 (-2.05%) |
223.03 |
218.00 - 224.20 |
1.2674 times |
Mon 27 October 2025 |
223.02 (0.86%) |
222.84 |
221.21 - 225.25 |
0.5973 times |
Fri 24 October 2025 |
221.11 (-3.03%) |
228.02 |
220.00 - 228.52 |
1.3151 times |
Thu 23 October 2025 |
228.02 (0.96%) |
226.29 |
225.60 - 231.28 |
0.8014 times |
Tue 21 October 2025 |
225.85 (1.07%) |
225.00 |
223.46 - 227.00 |
0.3609 times |
Mon 20 October 2025 |
223.46 (1.52%) |
222.50 |
217.99 - 224.51 |
0.6808 times |
Fri 17 October 2025 |
220.11 (-0.99%) |
222.75 |
218.21 - 224.47 |
2.4724 times |
Thu 16 October 2025 |
222.32 (1.74%) |
218.95 |
218.57 - 224.98 |
0.8959 times |
Wed 15 October 2025 |
218.52 (0.38%) |
219.45 |
216.90 - 219.99 |
0.5955 times |
Tue 14 October 2025 |
217.70 (-1.72%) |
222.15 |
217.00 - 222.71 |
1.1284 times |
Weekly price and charts SH Strong weekly Stock price targets for SH SHK are 222.2 and 234.03 | Weekly Target 1 | 212.91 | | Weekly Target 2 | 219.65 | | Weekly Target 3 | 224.74 | | Weekly Target 4 | 231.48 | | Weekly Target 5 | 236.57 |
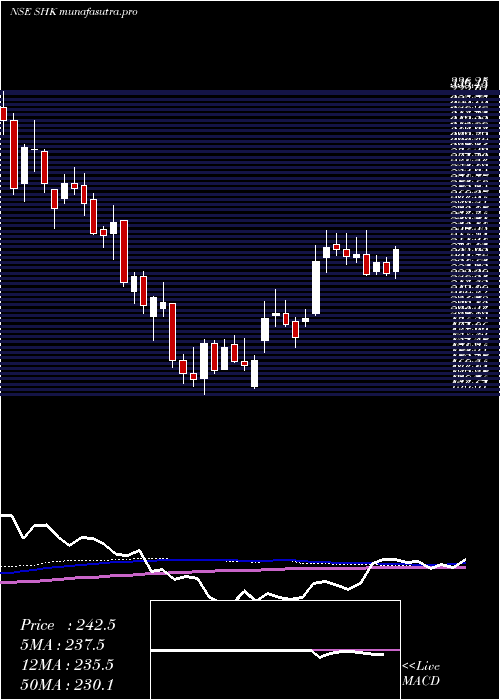
Weekly price and volumes for S H
| Date |
Closing |
Open |
Range |
Volume |
Wed 29 October 2025 |
226.39 (2.39%) |
222.84 |
218.00 - 229.83 |
0.2971 times |
Fri 24 October 2025 |
221.11 (0.45%) |
222.50 |
217.99 - 231.28 |
0.326 times |
Fri 17 October 2025 |
220.11 (-3.01%) |
226.05 |
216.90 - 226.85 |
0.6342 times |
Fri 10 October 2025 |
226.95 (-4.85%) |
238.60 |
223.01 - 243.51 |
0.6545 times |
Fri 03 October 2025 |
238.53 (3.41%) |
230.66 |
227.35 - 243.00 |
0.2648 times |
Fri 26 September 2025 |
230.66 (-7.29%) |
249.99 |
228.02 - 250.24 |
0.4285 times |
Fri 19 September 2025 |
248.80 (0.25%) |
248.19 |
245.57 - 255.79 |
0.4988 times |
Fri 12 September 2025 |
248.19 (-4.46%) |
259.77 |
244.00 - 263.15 |
0.6313 times |
Fri 05 September 2025 |
259.77 (4.35%) |
249.00 |
245.30 - 275.50 |
1.3356 times |
Fri 29 August 2025 |
248.95 (10.64%) |
224.20 |
223.40 - 252.10 |
4.9291 times |
Fri 22 August 2025 |
225.00 (3.45%) |
219.80 |
212.50 - 234.30 |
1.517 times |
Monthly price and charts SH Strong monthly Stock price targets for SH SHK are 208.34 and 234.95 | Monthly Target 1 | 202.32 | | Monthly Target 2 | 214.36 | | Monthly Target 3 | 228.93333333333 | | Monthly Target 4 | 240.97 | | Monthly Target 5 | 255.54 |
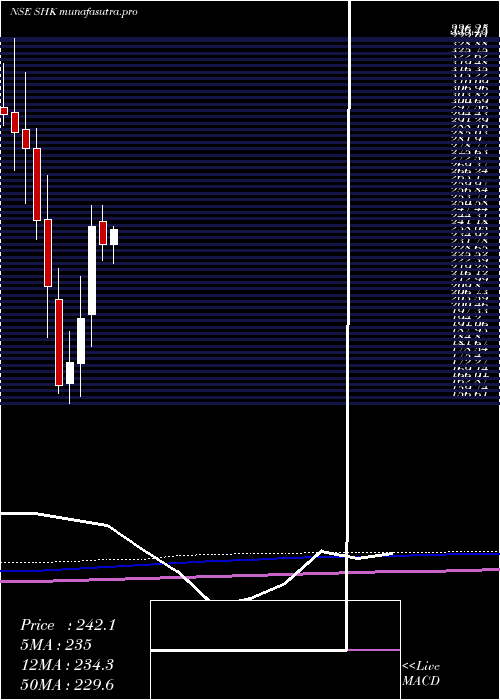
Monthly price and volumes S H
| Date |
Closing |
Open |
Range |
Volume |
Wed 29 October 2025 |
226.39 (-1.93%) |
233.15 |
216.90 - 243.51 |
0.4967 times |
Tue 30 September 2025 |
230.85 (-7.27%) |
249.00 |
227.35 - 275.50 |
0.7257 times |
Fri 29 August 2025 |
248.95 (-3.23%) |
257.90 |
212.50 - 259.00 |
1.8983 times |
Thu 31 July 2025 |
257.26 (9.5%) |
234.93 |
225.70 - 269.04 |
1.0335 times |
Mon 30 June 2025 |
234.93 (-3.59%) |
246.00 |
227.10 - 254.00 |
0.7429 times |
Fri 30 May 2025 |
243.68 (22.64%) |
200.28 |
184.87 - 254.05 |
1.2914 times |
Wed 30 April 2025 |
198.69 (12.51%) |
176.50 |
160.00 - 219.27 |
1.2118 times |
Fri 28 March 2025 |
176.60 (6.7%) |
166.40 |
156.61 - 192.00 |
0.9 times |
Fri 28 February 2025 |
165.51 (-22.74%) |
208.00 |
161.40 - 222.90 |
0.8173 times |
Fri 31 January 2025 |
214.22 (-13.17%) |
247.05 |
188.95 - 268.75 |
0.8824 times |
Tue 31 December 2024 |
246.70 (-12.5%) |
282.00 |
237.10 - 291.60 |
0.5622 times |
DMA SMA EMA moving averages of S H SHK
DMA (daily moving average) of S H SHK
| DMA period | DMA value | | 5 day DMA | 223.4 | | 12 day DMA | 222.21 | | 20 day DMA | 226.35 | | 35 day DMA | 234.51 | | 50 day DMA | 236.27 | | 100 day DMA | 239.04 | | 150 day DMA | 227.93 | | 200 day DMA | 219.84 | EMA (exponential moving average) of S H SHK
| EMA period | EMA current | EMA prev | EMA prev2 | | 5 day EMA | 223.32 | 221.78 | 223.45 | | 12 day EMA | 224.33 | 223.96 | 224.96 | | 20 day EMA | 226.72 | 226.75 | 227.62 | | 35 day EMA | 230.17 | 230.39 | 231.09 | | 50 day EMA | 234.42 | 234.75 | 235.41 |
SMA (simple moving average) of S H SHK
| SMA period | SMA current | SMA prev | SMA prev2 | | 5 day SMA | 223.4 | 223.29 | 224.29 | | 12 day SMA | 222.21 | 222.25 | 223.03 | | 20 day SMA | 226.35 | 226.57 | 227.18 | | 35 day SMA | 234.51 | 235.3 | 236.48 | | 50 day SMA | 236.27 | 236.09 | 236.2 | | 100 day SMA | 239.04 | 239.22 | 239.46 | | 150 day SMA | 227.93 | 227.63 | 227.4 | | 200 day SMA | 219.84 | 219.85 | 219.99 |
|
|
