ShivalikRasayan SHIVALIK full analysis,charts,indicators,moving averages,SMA,DMA,EMA,ADX,MACD,RSIShivalik Rasayan SHIVALIK WideScreen charts, DMA,SMA,EMA technical analysis, forecast prediction, by indicators ADX,MACD,RSI,CCI NSE stock exchange
Daily price and charts and targets ShivalikRasayan Strong Daily Stock price targets for ShivalikRasayan SHIVALIK are 402.23 and 416.83 | Daily Target 1 | 399.42 | | Daily Target 2 | 405.03 | | Daily Target 3 | 414.01666666667 | | Daily Target 4 | 419.63 | | Daily Target 5 | 428.62 |
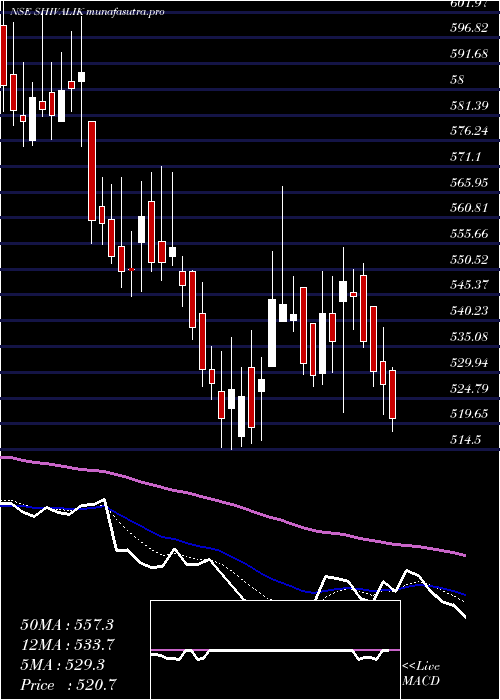
Daily price and volume Shivalik Rasayan
| Date |
Closing |
Open |
Range |
Volume |
Tue 28 October 2025 |
410.65 (0.06%) |
412.05 |
408.40 - 423.00 |
1.5234 times |
Mon 27 October 2025 |
410.40 (-0.11%) |
413.00 |
407.05 - 414.00 |
1.0579 times |
Fri 24 October 2025 |
410.85 (-2.04%) |
420.00 |
408.05 - 420.00 |
1.2687 times |
Thu 23 October 2025 |
419.40 (-0.1%) |
422.15 |
412.00 - 427.60 |
2.4879 times |
Tue 21 October 2025 |
419.80 (1.73%) |
415.80 |
414.05 - 422.70 |
0.2459 times |
Mon 20 October 2025 |
412.65 (1.16%) |
412.10 |
405.05 - 414.80 |
0.3824 times |
Fri 17 October 2025 |
407.90 (-1.16%) |
414.00 |
404.00 - 416.95 |
1.0817 times |
Thu 16 October 2025 |
412.70 (-0.07%) |
414.65 |
410.25 - 421.00 |
0.5978 times |
Wed 15 October 2025 |
413.00 (-1.5%) |
423.50 |
409.80 - 423.50 |
0.7819 times |
Tue 14 October 2025 |
419.30 (-1.27%) |
426.40 |
416.10 - 427.00 |
0.5724 times |
Mon 13 October 2025 |
424.70 (-1.38%) |
431.50 |
419.60 - 432.25 |
0.5089 times |
Weekly price and charts ShivalikRasayan Strong weekly Stock price targets for ShivalikRasayan SHIVALIK are 400.88 and 416.83 | Weekly Target 1 | 397.62 | | Weekly Target 2 | 404.13 | | Weekly Target 3 | 413.56666666667 | | Weekly Target 4 | 420.08 | | Weekly Target 5 | 429.52 |
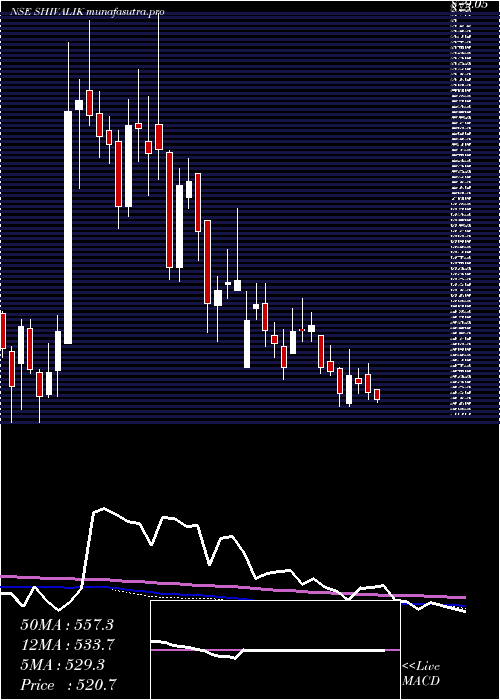
Weekly price and volumes for Shivalik Rasayan
| Date |
Closing |
Open |
Range |
Volume |
Tue 28 October 2025 |
410.65 (-0.05%) |
413.00 |
407.05 - 423.00 |
0.5473 times |
Fri 24 October 2025 |
410.85 (0.72%) |
412.10 |
405.05 - 427.60 |
0.9297 times |
Fri 17 October 2025 |
407.90 (-5.28%) |
431.50 |
404.00 - 432.25 |
0.7512 times |
Fri 10 October 2025 |
430.65 (-2.05%) |
440.50 |
409.15 - 449.95 |
1.0564 times |
Fri 03 October 2025 |
439.65 (0.65%) |
440.35 |
433.15 - 459.80 |
0.3985 times |
Fri 26 September 2025 |
436.80 (-8.17%) |
474.50 |
429.70 - 479.95 |
0.9449 times |
Fri 19 September 2025 |
475.65 (-0.75%) |
479.80 |
471.05 - 491.90 |
0.5891 times |
Fri 12 September 2025 |
479.25 (6.57%) |
451.95 |
440.70 - 496.00 |
3.3381 times |
Fri 05 September 2025 |
449.70 (-1.93%) |
465.90 |
448.10 - 475.45 |
0.7996 times |
Fri 29 August 2025 |
458.55 (-7.66%) |
495.05 |
456.00 - 503.00 |
0.6453 times |
Fri 22 August 2025 |
496.60 (-3.58%) |
515.00 |
494.00 - 524.45 |
1.0115 times |
Monthly price and charts ShivalikRasayan Strong monthly Stock price targets for ShivalikRasayan SHIVALIK are 384.35 and 430.3 | Monthly Target 1 | 375.58 | | Monthly Target 2 | 393.12 | | Monthly Target 3 | 421.53333333333 | | Monthly Target 4 | 439.07 | | Monthly Target 5 | 467.48 |
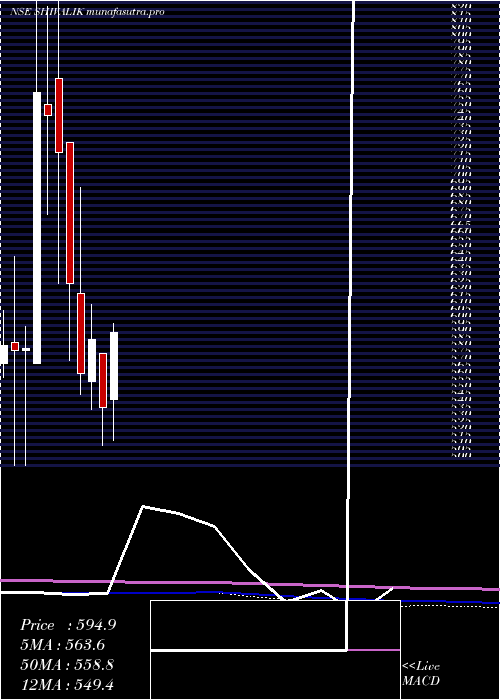
Monthly price and volumes Shivalik Rasayan
| Date |
Closing |
Open |
Range |
Volume |
Tue 28 October 2025 |
410.65 (-6.15%) |
439.30 |
404.00 - 449.95 |
0.5598 times |
Tue 30 September 2025 |
437.55 (-4.58%) |
465.90 |
429.70 - 496.00 |
0.9647 times |
Fri 29 August 2025 |
458.55 (-24.02%) |
593.65 |
456.00 - 622.00 |
0.6755 times |
Thu 31 July 2025 |
603.55 (11.45%) |
546.90 |
518.10 - 651.00 |
1.4988 times |
Mon 30 June 2025 |
541.55 (-8.2%) |
580.00 |
514.50 - 580.00 |
0.6654 times |
Fri 30 May 2025 |
589.95 (4.25%) |
560.00 |
539.95 - 615.00 |
0.4235 times |
Wed 30 April 2025 |
565.90 (-10.1%) |
622.45 |
551.00 - 698.05 |
0.5398 times |
Fri 28 March 2025 |
629.45 (-12.93%) |
730.15 |
574.70 - 730.15 |
1.1553 times |
Fri 28 February 2025 |
722.95 (-3.54%) |
776.00 |
630.10 - 879.05 |
2.0378 times |
Fri 31 January 2025 |
749.50 (-2.12%) |
757.00 |
679.20 - 827.00 |
1.4795 times |
Tue 31 December 2024 |
765.70 (31.16%) |
573.00 |
573.00 - 872.50 |
4.5958 times |
DMA SMA EMA moving averages of Shivalik Rasayan SHIVALIK
DMA (daily moving average) of Shivalik Rasayan SHIVALIK
| DMA period | DMA value | | 5 day DMA | 414.22 | | 12 day DMA | 416 | | 20 day DMA | 422.59 | | 35 day DMA | 442.9 | | 50 day DMA | 454.57 | | 100 day DMA | 502.58 | | 150 day DMA | 534.24 | | 200 day DMA | 578.61 | EMA (exponential moving average) of Shivalik Rasayan SHIVALIK
| EMA period | EMA current | EMA prev | EMA prev2 | | 5 day EMA | 412.53 | 413.47 | 415 | | 12 day EMA | 417.35 | 418.57 | 420.05 | | 20 day EMA | 425.33 | 426.87 | 428.6 | | 35 day EMA | 440.72 | 442.49 | 444.38 | | 50 day EMA | 458 | 459.93 | 461.95 |
SMA (simple moving average) of Shivalik Rasayan SHIVALIK
| SMA period | SMA current | SMA prev | SMA prev2 | | 5 day SMA | 414.22 | 414.62 | 414.12 | | 12 day SMA | 416 | 416.89 | 417.66 | | 20 day SMA | 422.59 | 423.89 | 426.21 | | 35 day SMA | 442.9 | 444.02 | 445.35 | | 50 day SMA | 454.57 | 456.57 | 459.5 | | 100 day SMA | 502.58 | 504.01 | 505.5 | | 150 day SMA | 534.24 | 535.52 | 536.63 | | 200 day SMA | 578.61 | 580.15 | 581.89 |
|
|
